

Comparing a Private Fund’s Net IRR to Public Market Terms
What Really Drives the Difference? - Guest Post by Hanoch Frankovits

Is 13% net IRR the same as 13% annual total return?
Trick question.
If you are sufficiently caffeinated, you may remember my post about illiquidity premium in private markets (and what’s been happening to said premium):

Today’s guest post picks up from that discussion.
Hanoch Frankovits, a financial researcher with expertise in applied investments, capital markets, and financial modeling, breaks down why a Net IRR from a closed-end private equity fund isn’t directly comparable to the total return from a public ETF, and how LPs can adjust for the difference.

If you’ve ever wanted to translate IRR into something more apples-to-apples with public market returns, this is for you.
👉 Bonus: there’s a downloadable spreadsheet at the end so you can run the numbers yourself (and a PDF with a deeper dive into this topic).
-Leyla
Five “Hidden” Costs
When LPs see a 13% Net IRR from a closed end private equity fund, they often compare it to a 9% annual total return from a public equity ETF. On the surface, it looks like outperformance - but this is apples to oranges.
Net IRR and public total return reflect different calculation methods, and apply to fundamentally different types of products. To make a fair comparison, we need to adjust for the unique frictions of closed end private funds, those “hidden costs” that public markets don’t have.
There are five key factors that drive this gap:
1. Illiquidity
Private funds lock up capital for years. Traded products don’t. LPs deserve a premium for this lack of flexibility.
2. Capital Call Timing
You don’t get to choose when to invest. The fund calls capital on its timeline, forcing LPs to hold idle cash or borrow, which drags down effective returns.
3. Distribution Timing
Again, timing isn’t in your control. Unlike public markets, where you can exit when you choose, private funds return capital at their discretion.
4. Uncertainty Around Total Capital Called
Funds rarely use 100% of committed capital. LPs may keep too much or too little liquidity on hand, creating inefficiencies.
5. Term Extensions
The fund might run longer than expected, tying up capital and compounding uncertainty.
Comparing Closed End Fund Net IRR to a Liquid Product
These frictions mean Net IRR of closed end funds overstates the real-world return compared to a liquid, traded product, from the point of view of the LP. For each of these frictions, the LP should “demand” a premium to compensate for the “worsening of conditions” they are exposed to. The sum of all these premiums should be subtracted from the Net IRR, in order to make a fair comparison with a comparable liquid investment’s total return.
These factors can be estimated given basic information about the fund and the LP, and the breakdown can be presented as follows:
Example
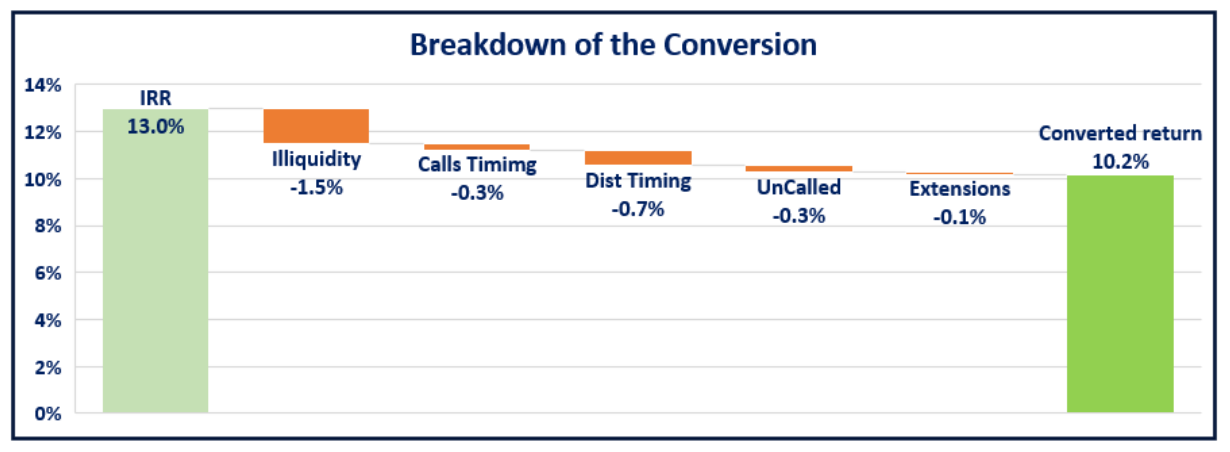
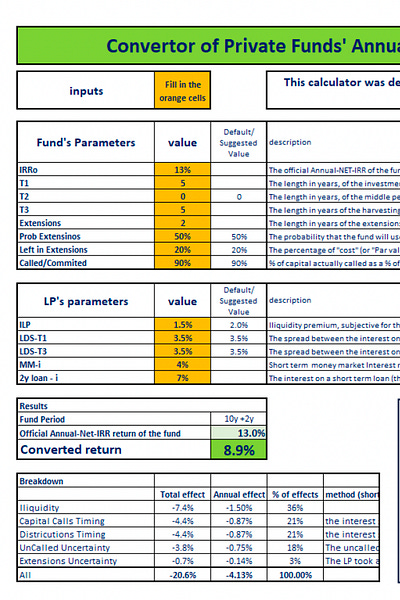
Let’s take a typical LP and a “standard” private fund with a 13% Annual Net IRR, a 10-year term + 2 optional extension years, a 5-year investment period (capital calls), and a 5-year distribution period.
The resulting gap is 4.1% annually - that is, an Annual Net IRR of 13% is effectively equivalent to 8.9% in Traded Annual Total Return terms.
Breaking this down by factor:
Illiquidity accounts for 36% of the gap;
The timing of capital calls and distributions contributes 42% (21% each);
Uncertainty about the total capital called contributes 18%;
Extension uncertainty accounts for the remaining 3%.

If we look at an identical fund (13% Net IRR, 10y+2) but with a shorter investment period - say just 2 years instead of 5 - the adjusted return jumps from 8.9% to 10.2%.
This highlights the importance of managing liquidity and the uncertainty faced by the LP during the capital call phase.
Bottom Line
When evaluating private fund opportunities, LPs need a more sophisticated approach than simply comparing headline Net IRR figures with public market returns. Our analysis shows that a substantial adjustment (often 300-400 basis points) is necessary to make these comparisons meaningful.
For a deeper dive, check out the PDF guide and use the accompanying spreadsheet to run your own side-by-side return comparisons.
About the author:
Hanoch Frankovits is a financial researcher specializing in applied investments, capital markets research, and financial modeling. He has extensive experience in capital markets across various roles, including: Head of Research at Buy-Side Partners, Head of Research at iFunds Capital (Alternative Investments), Head of Investment Research team at Bank Leumi, Chief Investment Strategist and Head of Investment Model Development at Videa.co.il (a robo-advisory firm), as well as advisor to family offices. His areas of expertise include asset allocation, investment analysis, portfolio risk management, and financial modeling.
Hanoch is an Israeli currently living with his family in France.
You can find him on LinkedIn (or via email at hanoch.frankovits@saddot.co.il)
Thank you for the wonderful hospitality!