

How to Read Financial Statements of a Private Credit Fund, a CRDEX Case Study, Part 2
Read the damn statements

I’m told lending money is the second oldest profession.
So by that logic, understanding how lenders make money (and how they pay you) is the third most useful skill.
In today’s post I’ll do my part to help you acquire that third skill.
We’re going to walk through how to evaluate a private credit fund, whether it’s a $25M hard money vehicle or a publicly traded BDC with $9B in assets. For this case study, we’re using CRDEX because it’s a ’40 Act fund and we have access to full financials.
If you missed Part 1, it’s a bummer, because we dug into the notes to the financial statements: fund structure, valuation methodology, fees, leverage, and unfunded commitments. The notes tell you how the fund operates (they aren’t written to keep you awake, however).
Fear not, you can still read it - and I can almost guarantee you won’t fall asleep:

Today, we’re looking at the actual numbers.
“But Leyla, I HATE reading financial statements with a passion”
This is my answer to you:

I’ll walk you through how I do a first pass to get a sense of any given fund.
And at the end of this post (I really need you to read this), I’ll include the LLM prompts so you have no excuse to avoid statements ever again.
30% of NAV in this fund is equity tranches of CLOs. Here’s an article that explains what they are:

➡️ Before we go any further, you need to look at this chart.
The story told in this chart does not appear anywhere in the primary financial statements. It lives in the Schedule of Investments. And unless you love spreadsheets and self-inflicted suffering, you’re not building this with a calculator. You can, however, build it with AI.
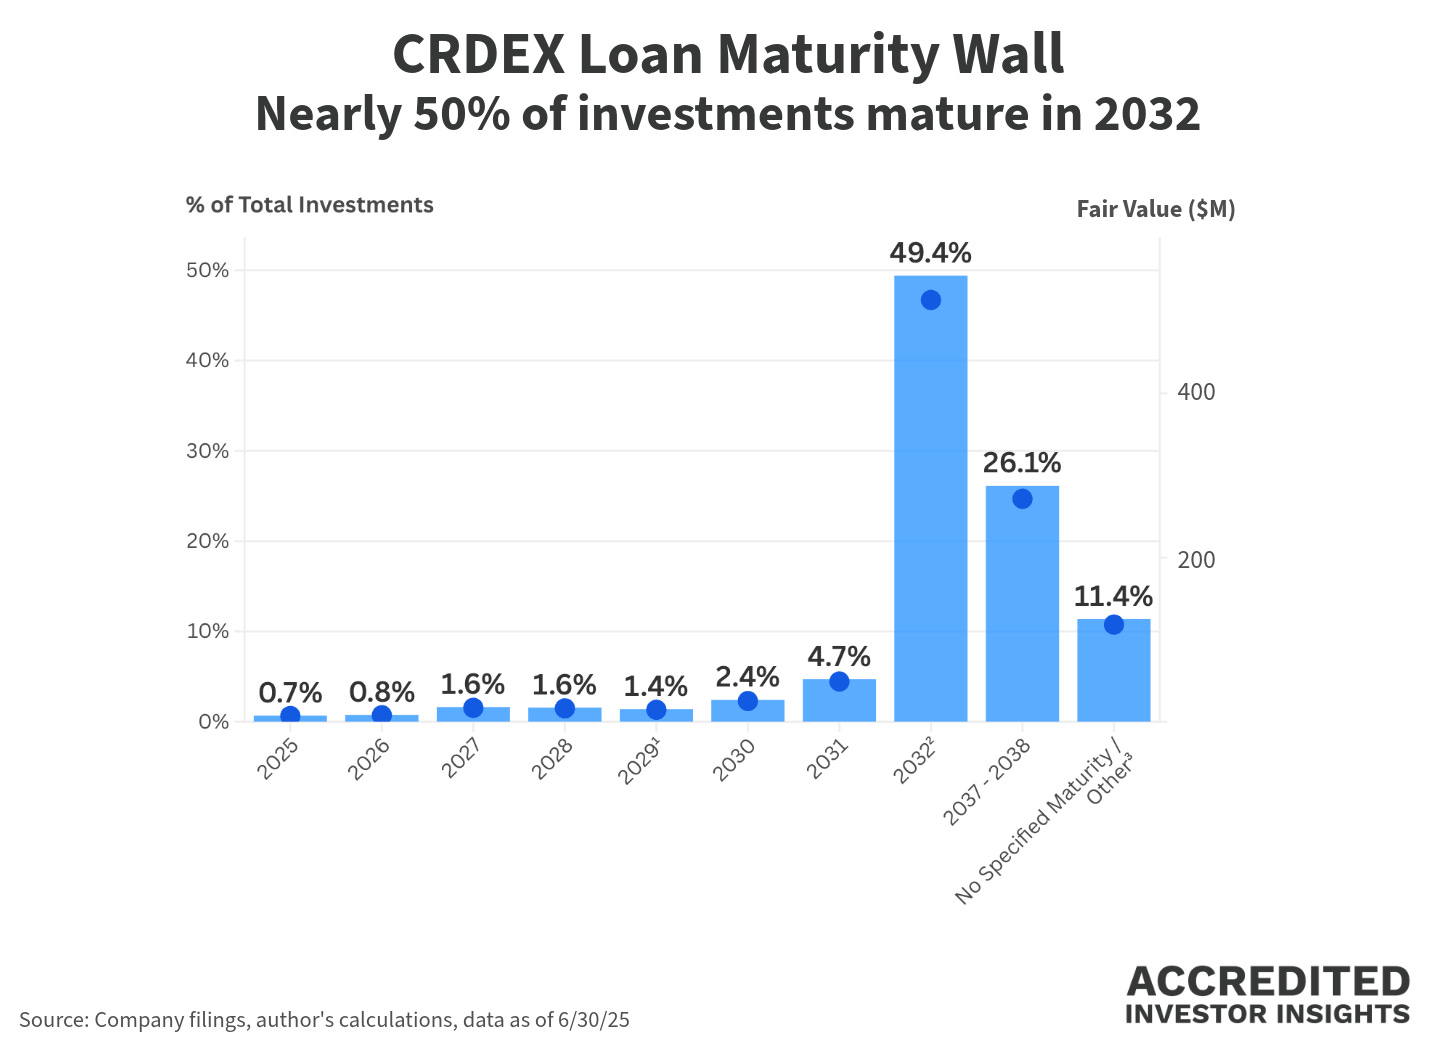
I used NotebookLM to generate the loan maturity table and then turned it into a visual (it was more accurate than Claude, btw). Because I’m nice like that.
This chart matters enormously once we get to the cash flow statement. But I’m getting ahead of myself. Let’s start at the beginning.
Disclosure: This case study is provided for educational purposes only and does not constitute an offer, solicitation, or recommendation to buy or sell any security or financial instrument. Nothing herein should be construed as legal, tax, investment, or financial advice. All opinions are my own and may change without notice. Readers should perform their own due diligence and consult qualified professionals before making any investment decisions.
The Balance Sheet (Statement of Assets and Liabilities)
TL;DR: I look at cost vs. marks, leverage, and cash. In that order.
I start here because it gives me the simple to grasp snapshot: what does the fund own, and what does it owe.
(Also, this is the first statement that appears in the 10-Ks and 10-Qs, and this sh*t is complicated enough, why make your life harder?)
1️⃣ Cost vs. Fair Value
As of June 30, 2025:
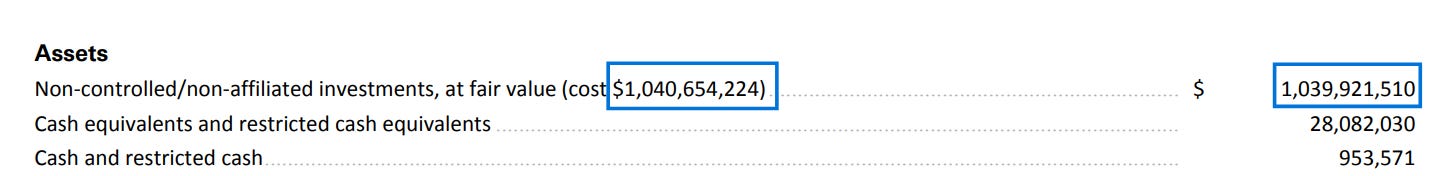
Investments at cost: $1.041B
Investments at fair value: $1.040B
That’s a net unrealized loss of ~$733K. (On a $1B portfolio, that’s basically noise).
We could have a long philosophical debate about marking Level 3 assets (and remember from Part 1, ~92% of this portfolio is Level 3). But the key takeaway is this: marks are fairly stable.

VERY IMPORTANT: always check whether the fund manager earns a performance fee on unrealized gains.
‼️ With CRDEX the incentive fee structure is explicitly limited to: