

Where $47M in NOI Meets $42M in Interest Expense
Inside Fundrise’s largest JV: negative cash flow, thin debt coverage, and the assumptions behind a $560M valuation

If you open the annual report for the Fundrise Real Estate Interval Fund, you’ll find a $1.2B portfolio, a 1.33% annual return, and a letter about real estate recovery.
What you won’t expect to find (40 pages deep in Exhibit C-1) is this:
The fund’s largest investment, a 3,500-home single-family rental portfolio, has generated negative operating cash flow for three consecutive years (as far as I looked).
2025: -$5.6M
2024: -$10.7M
2023: -$9.1M
This portfolio accounts for ~46% of the fund’s value.
👉 For more on interval funds and how they work:

What We’ll Cover Today
1️⃣ How the fund is structured (and why it’s so important to look at JV financials)
2️⃣ The operating performance of its largest investment
3️⃣ The debt stack (including a near-term maturity)
4️⃣ How the valuations get from a 3.3% cap rate on current NOI to the 5.3% cap rate the fund uses to mark the portfolio
Disclosure: This case study is provided for educational and informational purposes only and should not be construed as investment, legal, tax, or financial advice. The views expressed are solely those of the author. All examples are illustrative in nature and not guarantees of future outcomes. Readers should conduct their own independent research and consult with qualified professionals before making any investment or financial decisions.
👉 If you invest in real estate, you’ll want to start with our How to Read a Pro Forma series
Why Look at a JV?
First, some context on the fund itself. The Fundrise Real Estate Interval Fund (~$1.2B net assets) is a closed-end interval fund that invests in private real estate through co-investment joint ventures with Fundrise affiliates. Roughly 95% of assets are in these co-investment JVs.
Here’s another example of a real estate fund of funds:

Since fund-level financials are so simple, you can figure everything out yourself, right? Keep in mind, the income below is annualized, in $’000s, NAV is $1.2B.
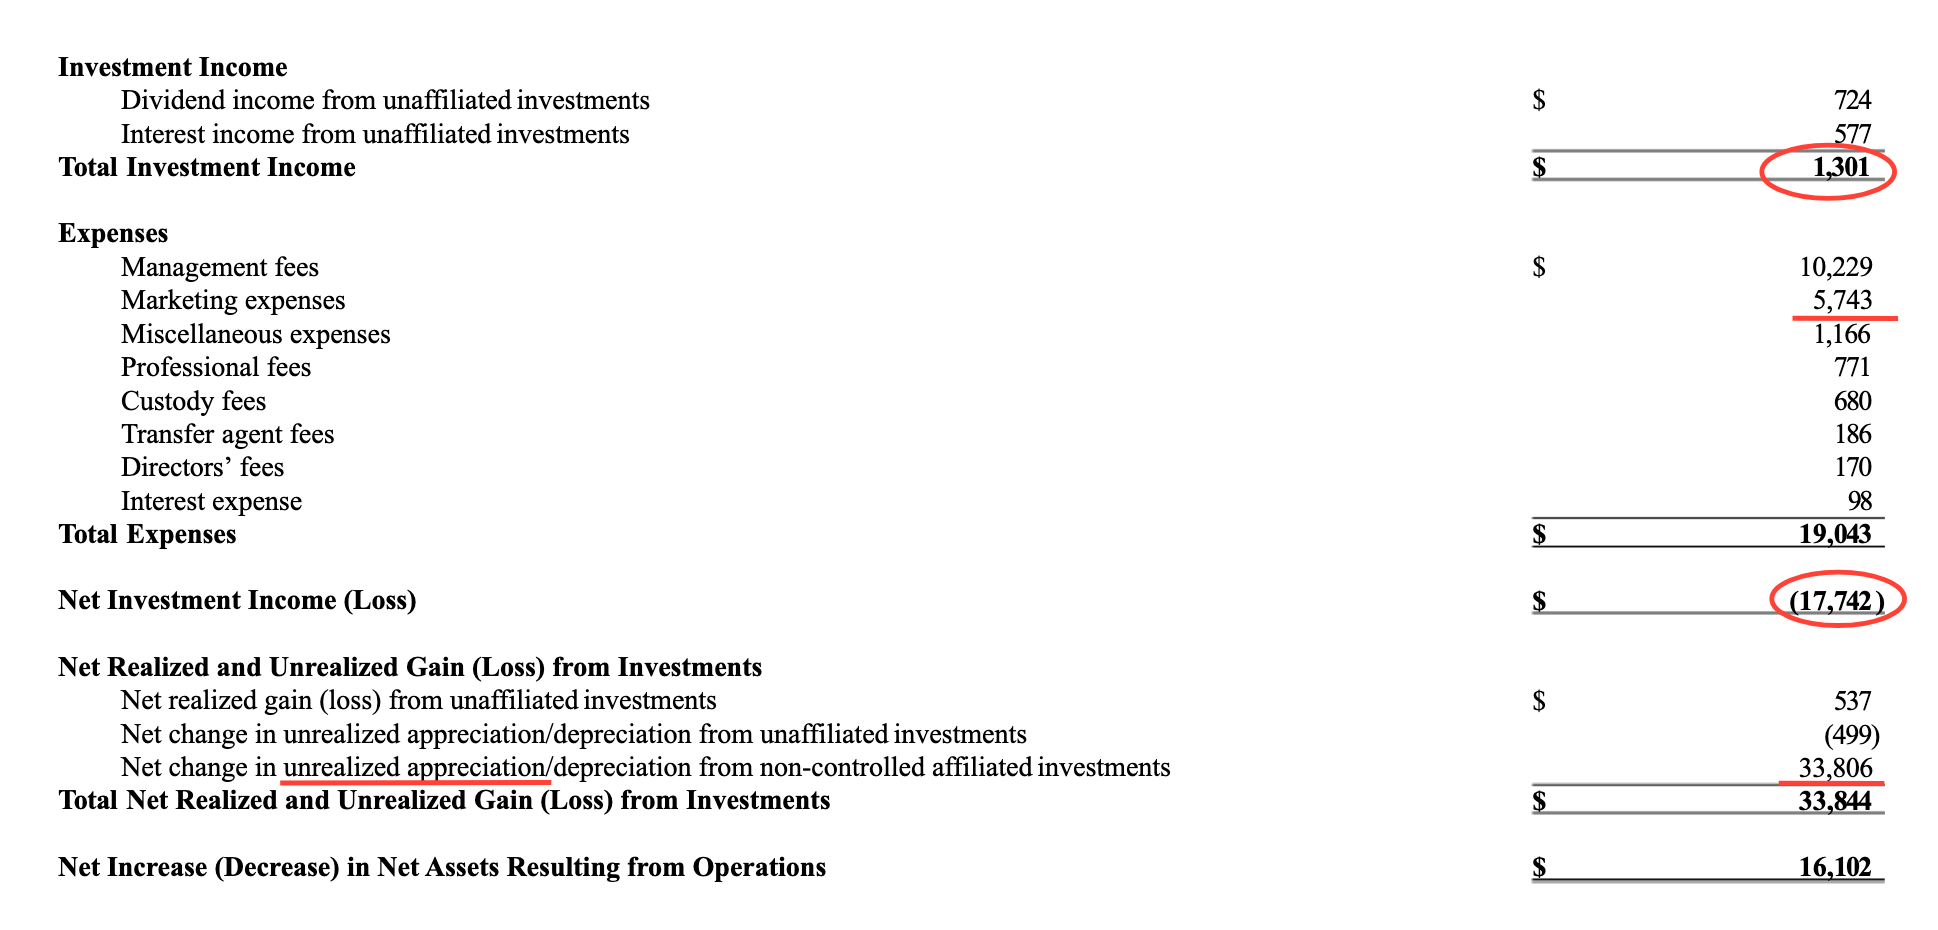
And in case this doesn’t tell you the story, let me help you out: the fund generated $1.3M of investment income. It then paid $10.2M in management fees, $5.7M in marketing, and other platform and professional fees. The increase in net assets is mostly from unrealized gains. It’s really not worth digging into this one any further.
Back to the FAR more interesting subject: the JV, and what its financials look like: