

Cliffwater Corporate Lending Fund (CCLFX)
What's inside, and what to watch

When I set out to write about this fund, I wanted an image that truly captured its scale and behavior. I’m not kidding - I spent hours thinking about it.
Enter: The Doomsday Machine.

In Star Trek, it’s a planet-eating, system-destroying monster. At the rate this fund is growing (46% CAGR since 2022 😱) it might just eat us all too.
In today’s case study we will:
1️⃣ Look at what’s inside the fund
2️⃣ Discuss the financials (sorry, but I’ll make you look at all three statements)
3️⃣ Review the sources of distributions and the flow of capital
And here’s the case study on CELFX, the younger sibling of this fund:

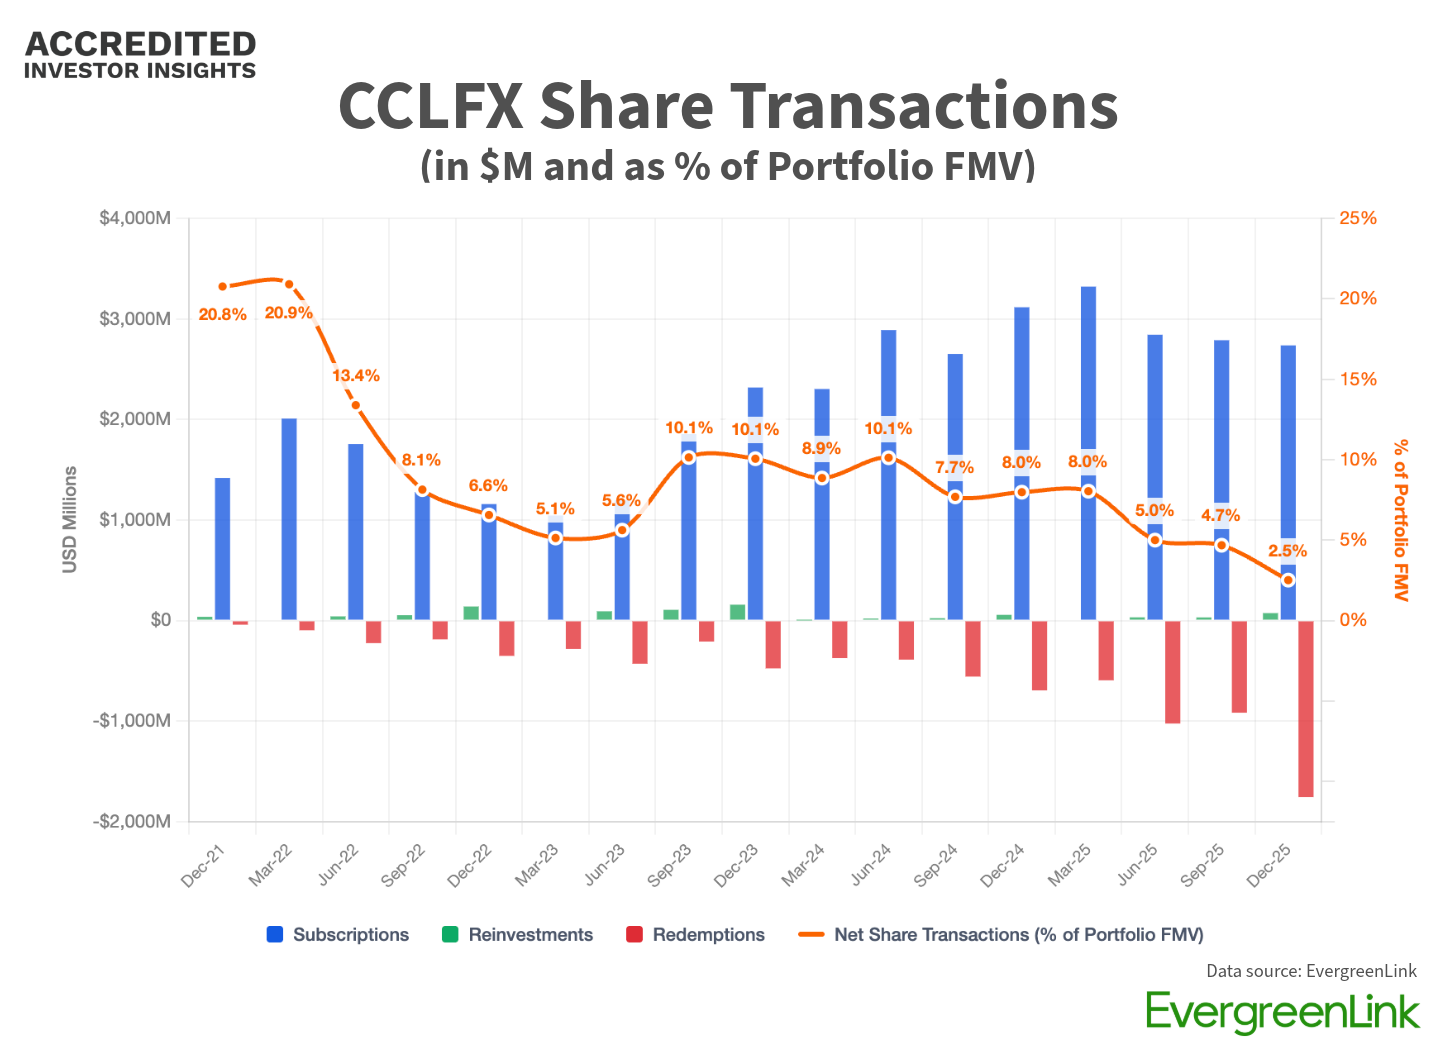
Before we get any further, take a look at the inflows into the fund. The orange line is net share transactions as % of fund’s total fair market value (FMV), bars represent share transactions in $M.
Disclosure: This case study is provided for educational and informational purposes only and should not be construed as investment, legal, tax, or financial advice. The views expressed are solely those of the author. All examples are illustrative in nature and not guarantees of future outcomes. Readers should conduct their own independent research and consult with qualified professionals before making any investment or financial decisions.
The Pitch
The Cliffwater Corporate Lending Fund (CCLFX) is a closed-end management investment company structured as an interval fund. And it’s big. $31.5B of net assets as of 9/30/25.
Its core strategy: hold at least 80% of assets in corporate loans, sourced through a “multi-lender” approach.
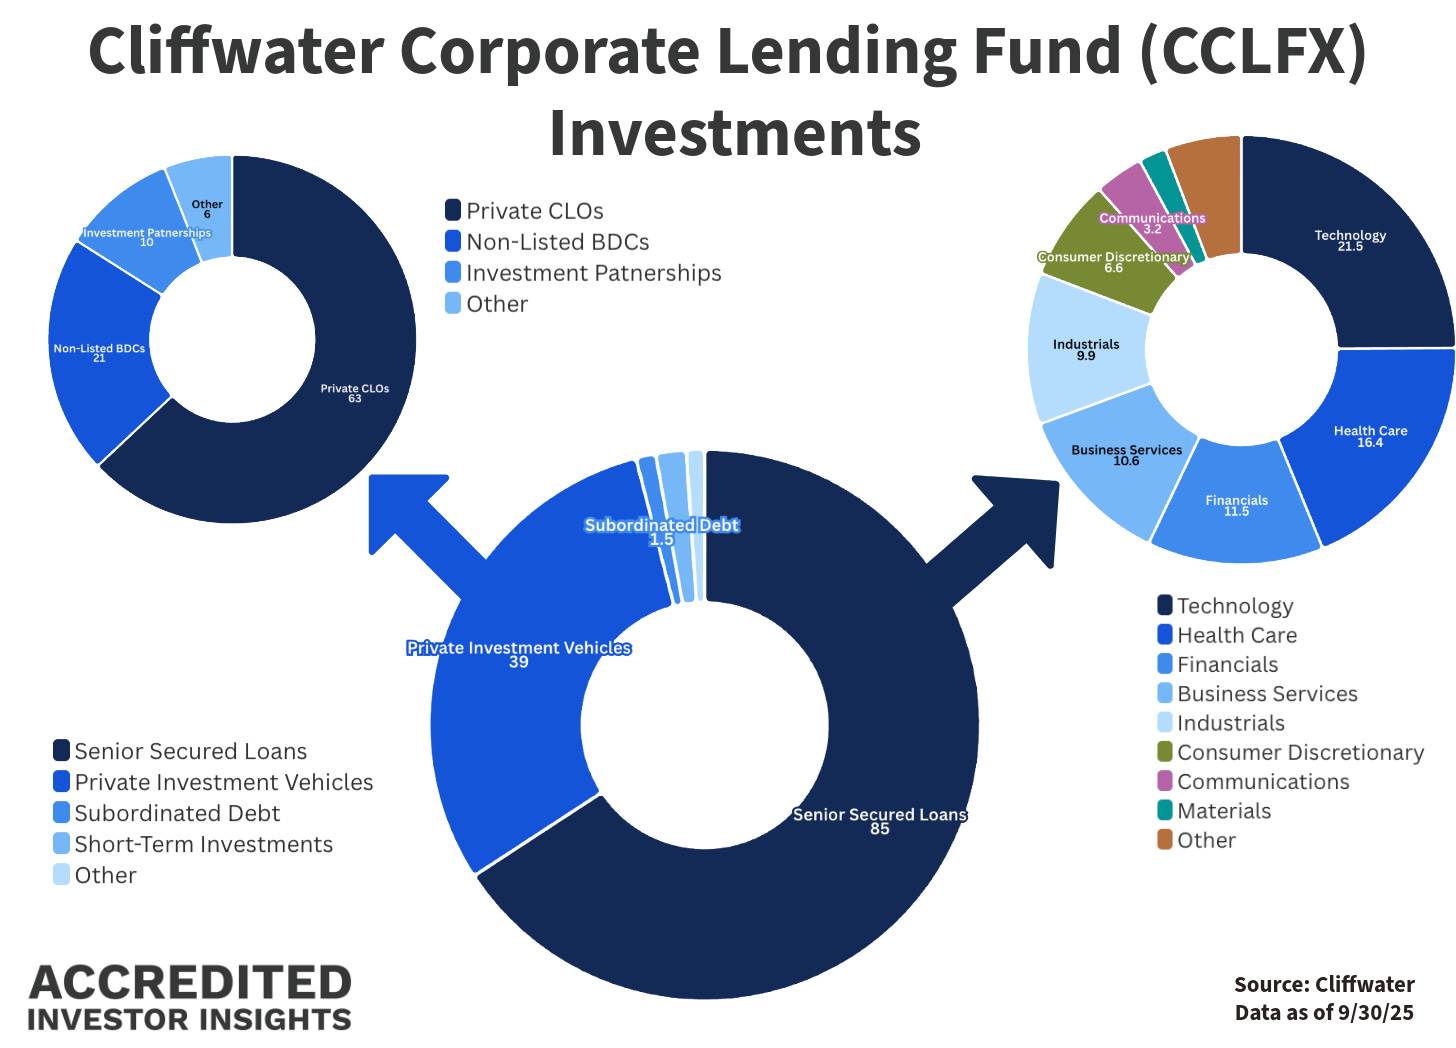
Nearly 39% of the portfolio is invested through Private Investment Vehicles, with significant exposure to:
Private CLOs: 24.4%
Non-Listed BDCs: 8.1%
💰 Returns:
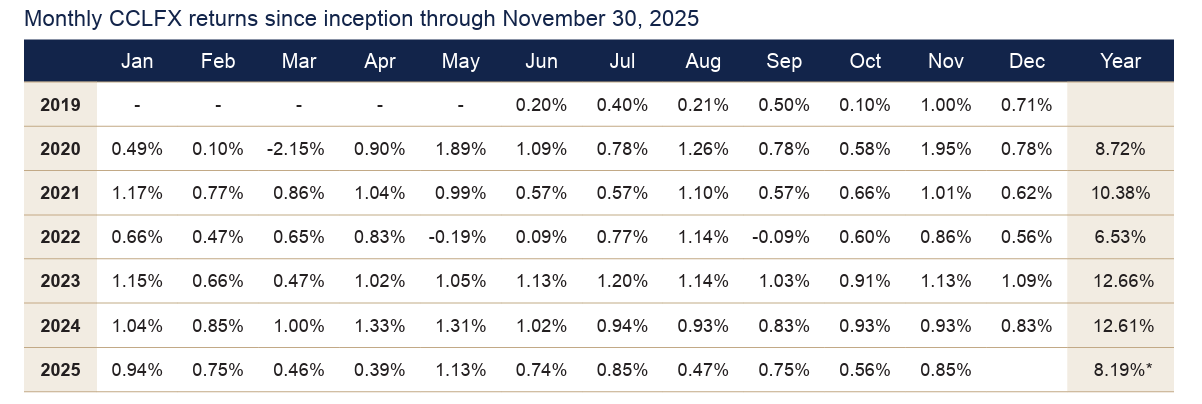
From inception through September 30, 2025, the Fund produced a net annualized return of 9.57%. Net assets grew nearly $3.4B in just six months, ending September 30, 2025. At this rate of growth, it will consume all of us…
👉Missed the primer on evergreen funds? Read it here:

What’s in the Fund?
Approximately 85% of total assets are invested in senior secured loans. Within that bucket, Technology (21.5%) and Health Care (16.4%) represent the largest industry exposures. 99% of loans are floating rate.
Private Investment Vehicles account for 39% of total assets, with the two largest categories being:
CLOs: 63% of private vehicles
Non-Listed BDCs: 21%
👉 “Leyla, what are CLOs???” - here you go:

Want specifics on the CLOs? You’re out of luck. This is the extent of what you’ll find:
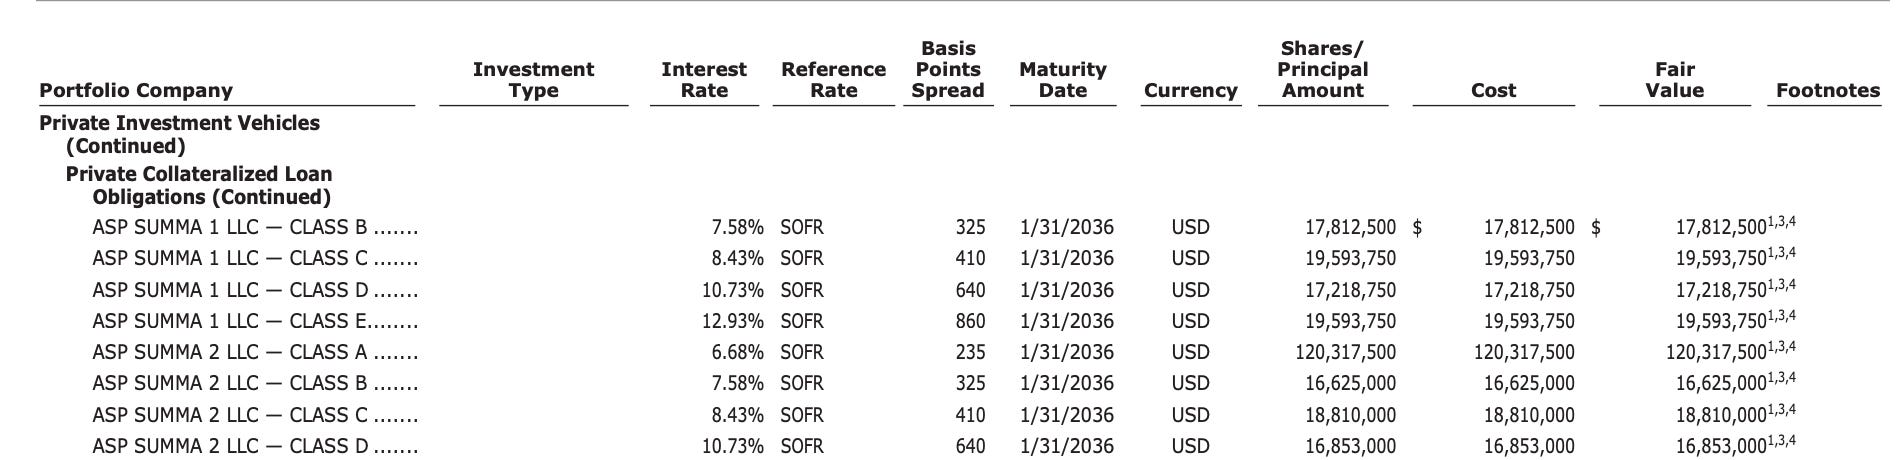
(The different classes likely represent various tranches of the same CLO, which explains the variance in interest rates: higher-rated tranches carry less risk).
👉 Before we get into the gory details, here’s a great overview on how to read fund financials:

Moving on to financial statements. Let’s start with the balance sheet: