

Goldman Sachs' Private Credit: GSBD vs GSCR
🧬 Anatomy (and DNA analysis) of two sibling BDCs

Today’s case study is a story of two brothers.
One is the golden child, beloved by investors, raising $3.3 billion in 2024 plus additional $2.2 billion in the first half of 2025.
The other? Less popular, down 14% over the past month and only managed to raise $109 million last year.
Both funds were birthed by Goldman Sachs. The older one is the publicly traded Goldman Sachs BDC (GSBD). The other, its non-traded sibling, is Goldman Sachs Private Credit Corp. (GSCR)
The younger, attractive sibling, by the way, holds one of the “cockroaches” on its books:
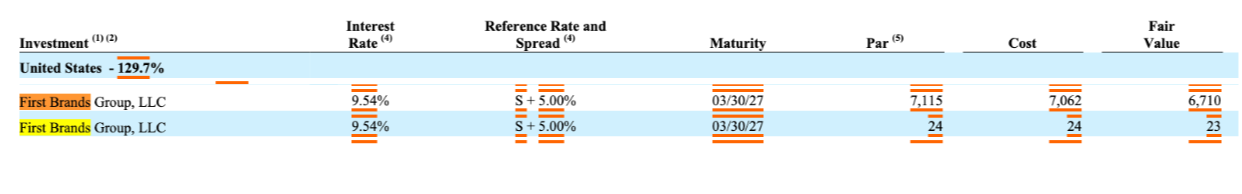
If you invest in private credit, start with this:

In today’s case study we will:
1️⃣ Take a look under the hood of each fund.
2️⃣ Break down the financials (don’t faint, I’ll keep it high level).
3️⃣ Use AI to see how much overlap exists between the portfolios.

Disclosure: This case study is provided for educational and informational purposes only and should not be construed as investment, legal, tax, or financial advice. The views expressed are solely those of the author. All examples are illustrative in nature and not guarantees of future outcomes. Readers should conduct their own independent research and consult with qualified professionals before making any investment or financial decisions.
Background
Both BDCs do essentially the same thing: provide financing to middle-market companies through senior secured loans and other private credit investments. Their goal is to generate income and capital appreciation by lending to businesses that are often too small to access traditional capital markets.
GSBD, the older sibling, IPO’d in 2015 and trades on the NYSE, meaning its share price is exposed to market swings and investor sentiment. As of 10/17/25, it was trading at a 25% discount to NAV.
Its non-traded sibling, Goldman Sachs Private Credit Corp, launched in late 2022 and sells shares directly at NAV, sidestepping market pricing entirely.
Fee structures
GSBD: 1% management fee on gross assets, 1.75% quarterly hurdle, catch-up, and 17.5% incentive fee.
GS Private Credit Corp: 1.25% annual management fee on net assets, 1.25% quarterly hurdle, catch-up, and 12.5% incentive fee.
Both funds accrue incentive fee on unrealized gains, but don’t pay it out until it becomes realized (here’s the case that taught me to check that).
Speaking of fees - read this post:

Some portfolio highlights:
What the filings tell us
GSBD’s largest industry exposures (by fair value, 12/31/24):
Software: 19.5%
Health Care Providers & Services: 10.5%
Financial Services: 9.4%
Professional Services: 9.1%
GS Private Credit Corp’s largest exposures:
Software: 14.2%
Commercial Services & Supplies: 7.9%
Machinery: 7.7%
Financial Services: 7.2%
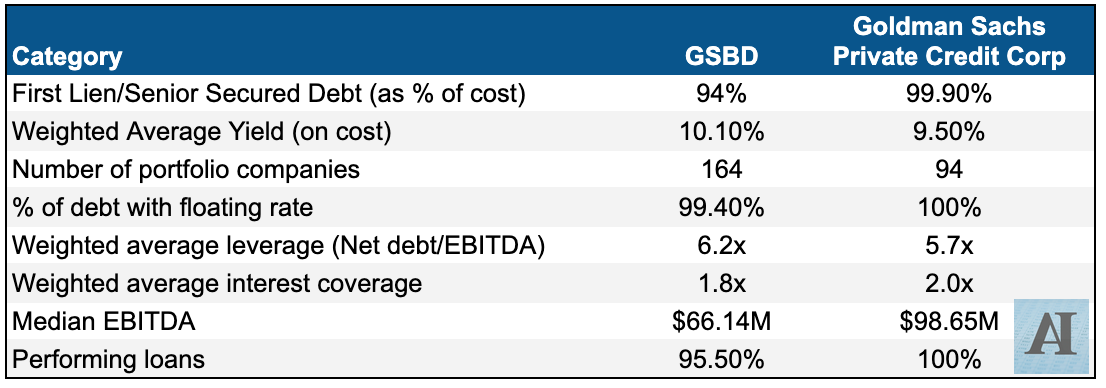
On the surface, they look similar, but look closer at the table above. GSBD’s borrowers generally have lower EBITDA, higher leverage, and weaker interest coverage ratios.
On the flip side, GSBD is more diversified. Its total assets are about half the size of GS Private Credit Corp’s, but it holds more portfolio companies, meaning each company represents a smaller slice of the overall pie. That’s a clear plus for investors.
👉 But here’s the kicker: there’s borrower overlap between the two funds.
Before I dive into how I screened for that using AI, let’s take a look at the balance sheet and income statement for each BDC.