

JPM Private Markets Fund: Losing Money on Operations, Up 74%
How a $1.4 billion fund generates double-digit returns without a single profitable quarter

JPMorgan Private Markets Fund (JPMF) has lost money on operations every single quarter since it launched in 2023.
And yet it’s up 73.5%.
Before you run off to invest: that’s the puzzle we’re going to solve today. The answer tells you something important about how returns get manufactured in the evergreen PE fund world.

If you invest in private equity, you need to read this:

In today’s case study we will:
1️⃣ What the fund is (and what’s inside)
2️⃣ How a fund with negative investment income generates positive returns
3️⃣ What's actually been realized vs. what's still a mark
Disclosure: This case study is provided for educational and informational purposes only and should not be construed as investment, legal, tax, or financial advice. The views expressed are solely those of the author. All examples are illustrative in nature and not guarantees of future outcomes. Readers should conduct their own independent research and consult with qualified professionals before making any investment or financial decisions.
The Pitch
JPMorgan Private Markets Fund (JPMF) is a non-traded interval fund that invests in private equity through three strategies:
co-investments alongside PE sponsors,
secondary purchases of existing fund stakes,
and primary commitments to newly formed funds.
“Leyla, what’s an interval fund?” — Here you go:

Structurally, this is a fund-of-funds (FoF).
I hope this doesn’t come as a shock, but I’m not a big fan of FoFs (and neither is Tim McGlinn, who wrote the guest post below):

As of September 30, 2025, the fund manages ~$1.39B in net assets across 94 PE positions in 70+ underlying vehicles. Class I shares have compounded from $10.00 to $17.35. That’s a 73.5% cumulative gain in just over two years (driven largely by a one-time markup surge in the fund's first weeks of operations), or roughly 12–13% annualized once you strip that out.
Let’s take a look at how it’s done. We’ll start from the top:
1️⃣ The Balance Sheet
As of September 30, 2025:
PE Investments: $1.07B
Liquidity sleeve: $404M (JPMorgan money market fund) + $2M cash
Total assets: ~$1.48B
Liabilities: ~$87M
Net assets: ~$1.39B
Technically off balance sheet, but an obligation nonetheless: $187.4M in unfunded commitments (13.5% of NAV). The $404M liquidity buffer covers this comfortably for now.
Here’s another fun case study:

What are the assets?
As of September 30, 2025, the PE portfolio carries a fair value of $978.6M against a cost basis of $789.6M. A ~24% aggregate mark-up. On paper.
Here’s how that breaks down by strategy:
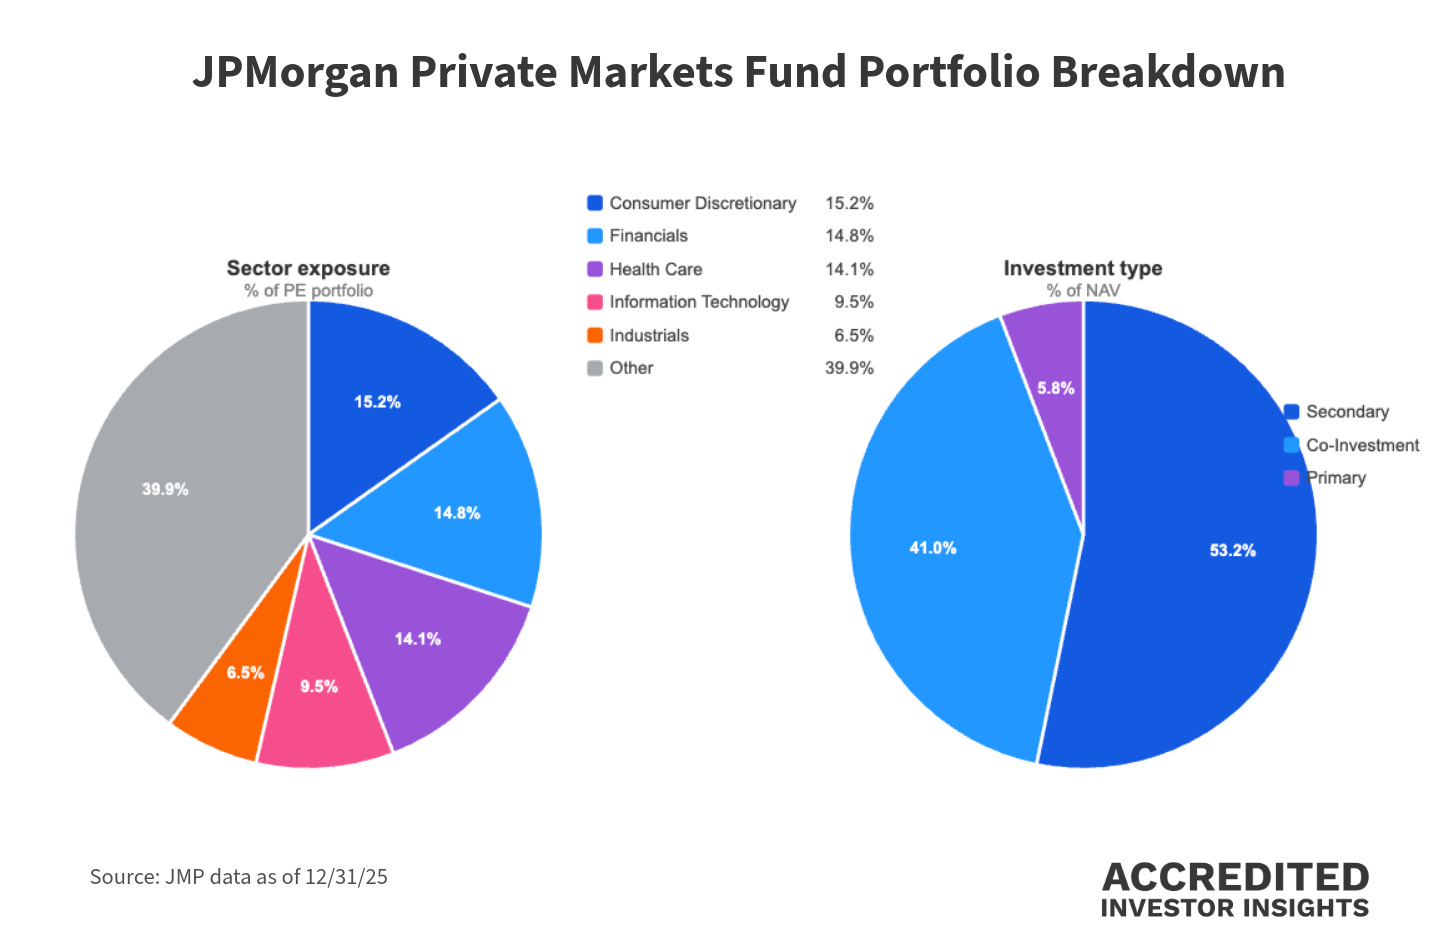
When we zoom in on the co-investment portfolio (the light blue 41% slice of the pie chart on the right), the sector exposure is more skewed toward software: