

🗞️ Sunday Digest: Private Markets Insights 7/20
McKinsey’s private markets report and NAR’s latest on CRE

Happy Sunday!
This week’s digest highlights two reports:
📊 McKinsey’s Global Private Markets Report
🏢 NAR’s Commercial Real Estate Market Insights
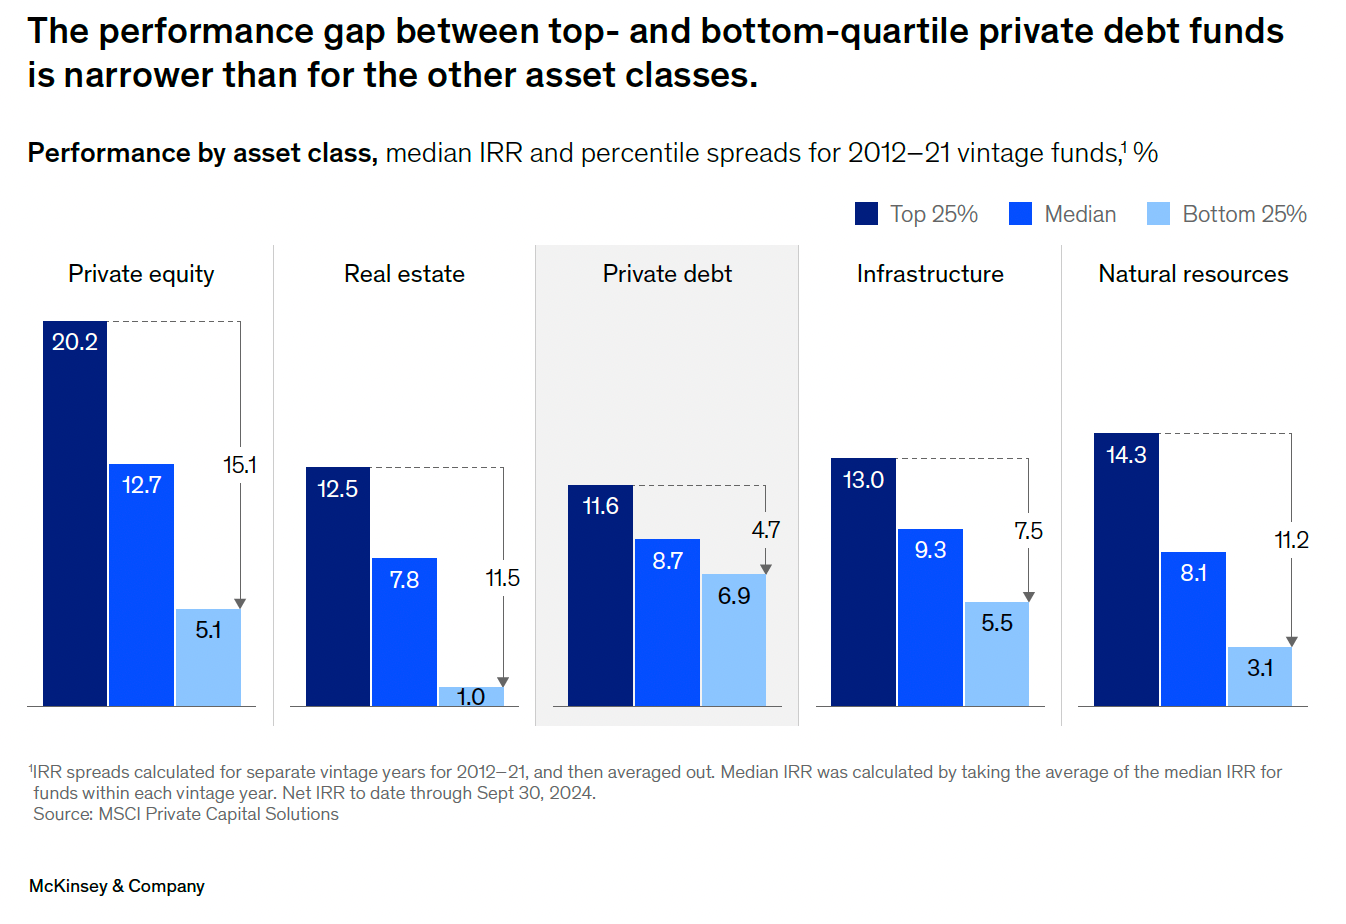
I’m not going to mince words here, I want you to burn the chart below into your brain. It shows the performance spread between top, median, and bottom quartile fund managers. The gap is staggering.
It has two big implications:
If you remember anything from stats class, you know how this kind of spread skews averages (especially when only the mean is reported).
As an LP, you better get really good at picking your GPs. Outsized returns are only generated by the top 25%. Stay tuned for an article on this topic.
Before we dive in:
Accredited Insight is one-of-a-kind: we are the only voice offering a perspective through the LP lens. We cover private credit, private equity, and CRE investing, drawing on thousands of data points and conversations with LPs, GPs, and service providers.
By becoming a paid subscriber, you will gain access to our database of over 30 case studies and articles on everything you need to know to become a better investor. If you are a GP, this is your window into the world of capital allocators. Click below to choose your plan:
👉 $10/month or $100/year.
📈 Private Equity
According to McKinsey, private equity started to shake off the slump in 2024. Dealmaking rebounded, distributions picked up, and for the first time since 2015, LPs got more back than they put in (just as many are re-centering on DPI as their top performance metric).
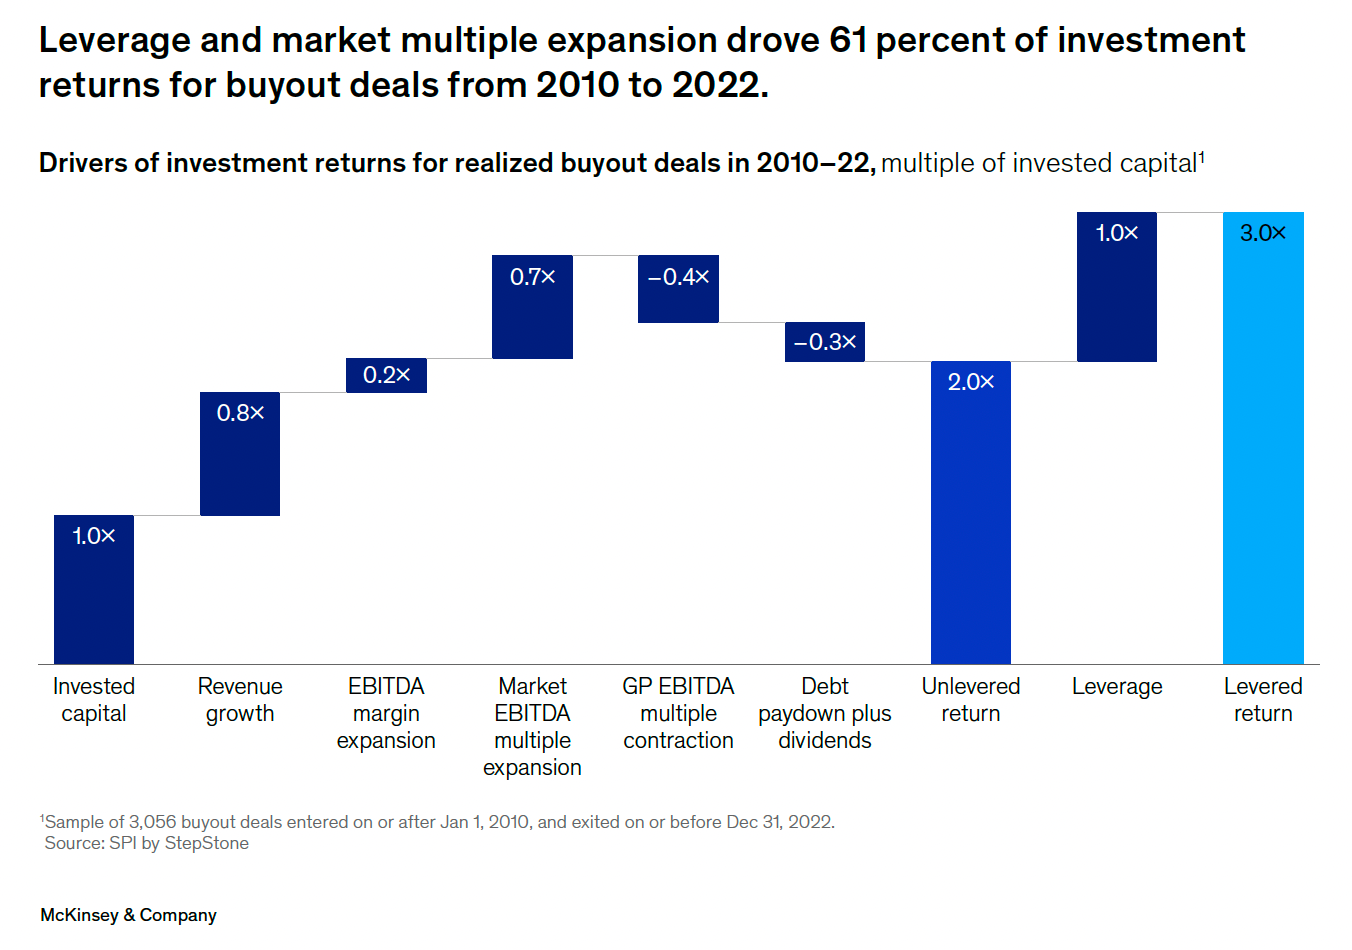
Analysis by StepStone Group indicates that, for deals done 2010–22, leverage and multiple expansion comprised 61% of returns. The remaining 39% came from revenue growth and EBITDA margin expansion:
Global PE deal value jumped 14% to $2T, making 2024 the third-biggest year on record.
The industry faces a historic exit backlog, with over 18,000 companies under PE ownership for more than four years, leading to extended holding periods and a mismatch between buyer and seller price expectations.
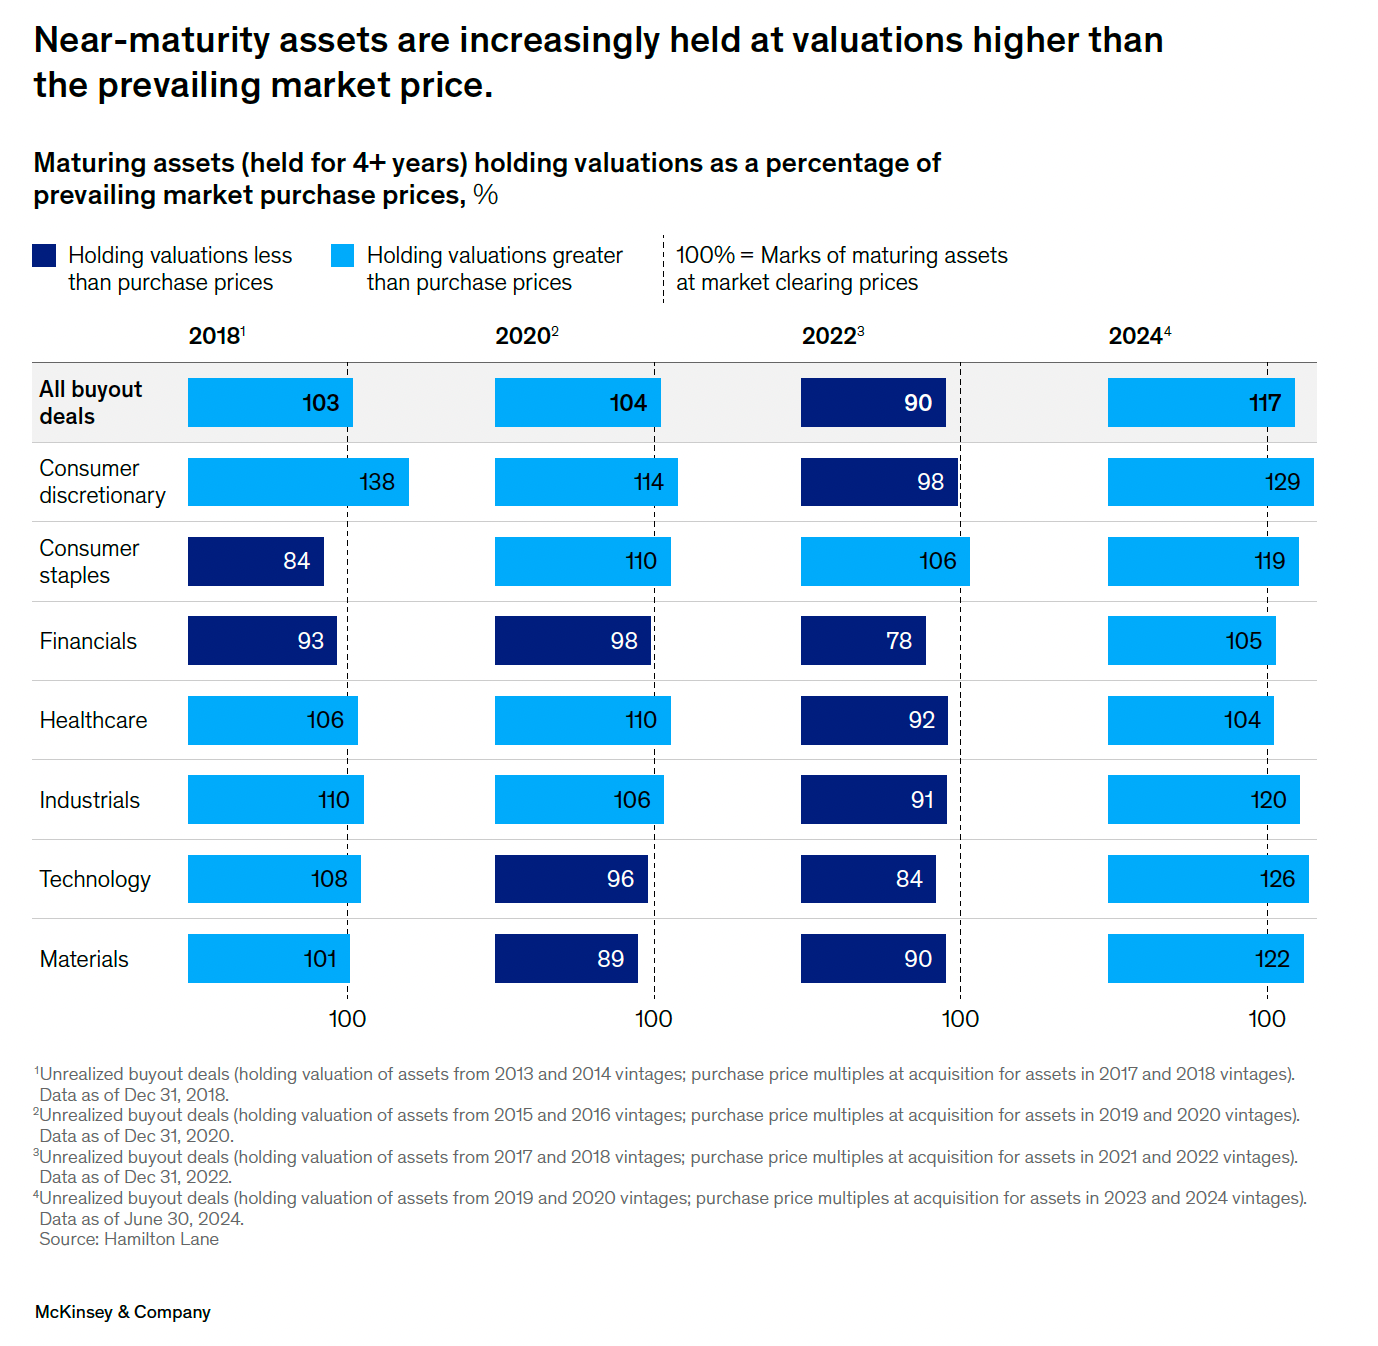
‼️ This chart should give you some pause: in 2024, private equity firms marked maturing assets at values 17% above market-clearing prices, up from just 4% in 2020 and 3% in 2018, according to Hamilton Lane. Unlike previous years, this overvaluation was consistent across all PE sectors.
💳 Private Credit
Private credit is on a tear (no surprises here): LBO financing surged 30%, and direct lending hit $122B, its third-highest total ever, even as overall private debt fundraising fell.
Spreads compressed to 2021 levels: less premium, more competition.
LP interest remains high: predictable cash flows, seniority in the stack, and solid performance relative to PE and real estate.
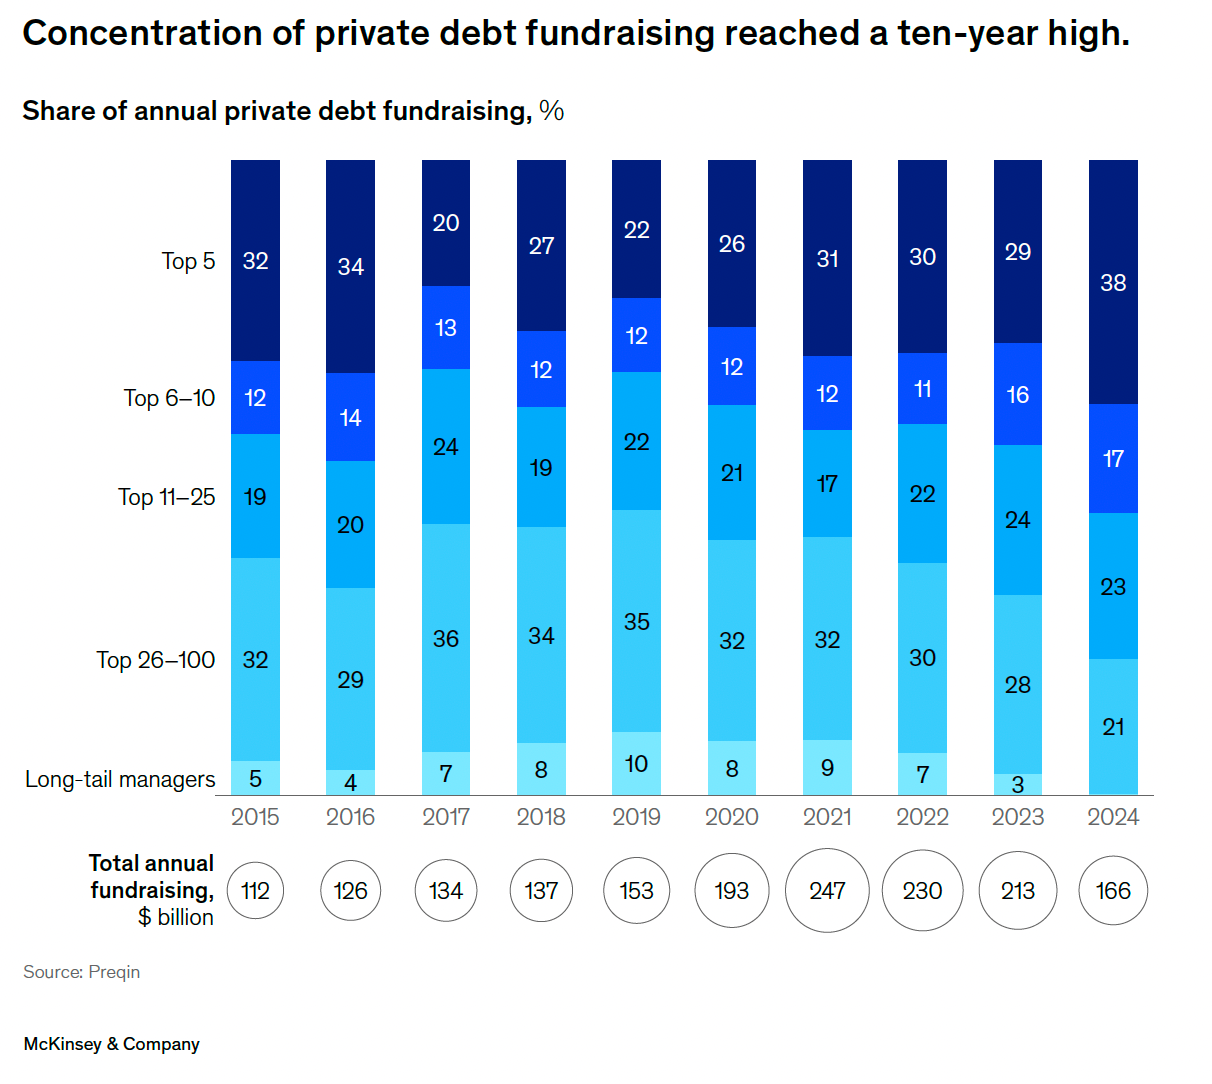
The big keep getting bigger: the top five managers raised 38% of private debt funds in 2024, a notable increase from prior years.
♻️ Secondaries
Are you sick of secondaries yet? If you are new here, read this first:

The secondaries market experienced significant growth in 2024:
Total deal volume increasing by 45% year over year to an all-time high of $162 billion.
This was driven by both LP-led transactions ($87 billion) and GP-led transactions ($75 billion), with 84% of GP-led deals being continuation vehicles.
Fundraising for secondaries also reached $65 billion, making it the third-highest year on record
We will be seeing a lot more secondary funds. Read this deep dive into Hamilton Lane’s fund and this primer:

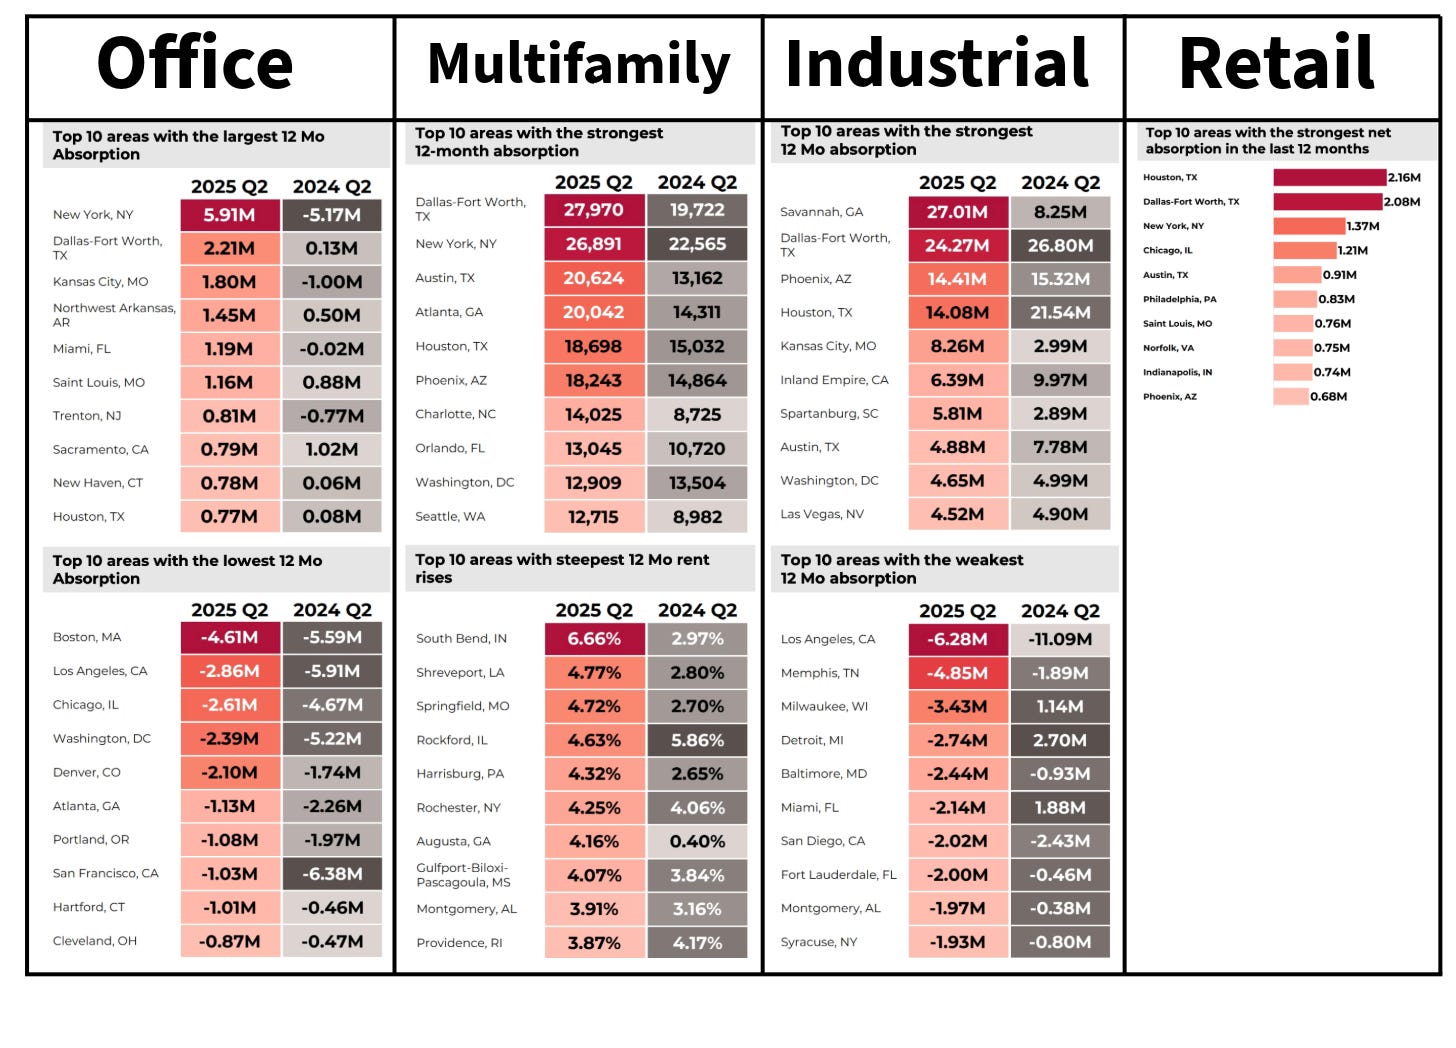
🏭 NAR Commercial Real Estate Report
Office: net absorption remains negative with vacancy at 14%; Class A office vacancies climbed to 20.3%, though Class B showed modest rent growth of 1.3%
Multifamily: With 544,000 units absorbed (a 22% rise YoY), vacancies held at 8% and rent growth slowed to 1.1%; Class A still leads in vacancies, while Class B drives demand. New supply still outpaces demand by 16%.
If you invest in real estate deals, you’ll love our series on how to read a pro forma

Retail: net absorption slowed (just 9.5M SF compared to previous years), rent growth eased to 1.8%, and vacancy ticked up to 2.6% (its first increase in nine quarters)
Industrial: high new supply pushed vacancy up to 7.2%; rent growth slowed to 2.1%. This is still the darling of CRE.
Hospitality: hotel occupancy remained at 63%, average daily rate (ADR) reached $160 (+22% vs. April 2019), and revenue per available room (RevPAR) improved to $101 (+17% over April 2019).
New here?
Check out some of our popular topics to get started:
If you have any questions or suggestions, just hit reply — I’d love to hear from you!
-Leyla