The Problem With PME
Why the metric is flawed - and what will kill it. Guest Post by Hanoch Frankovits
The Public Market Equivalent (PME) was meant to create an “apples-to-apples” benchmark for private markets.
In today’s guest post, Hanoch Frankovits explains why that comparison doesn’t hold up, and why PME is more like slicing oranges into apple shapes and pretending they’re the same fruit.
Hanoch is a financial researcher with deep expertise in applied investments, capital markets, and financial modeling. His full bio and contact details are at the end of the post.
—Leyla
If you missed Hanoch’s earlier post on comparing IRR between private funds and public returns, you can read it here:
What Is PME
The PME (Public Market Equivalent) method, developed by Austin M. Long and Craig J. Nickels and introduced in a 1996 paper, was designed to compare the performance of private closed-end drawdown funds to that of public market instruments.
The method is elegant and has become widely used in performance evaluation of such funds. It relies on the timing and magnitude of cash flows to the investor from the private fund. Specifically, it models the investment in the private fund as follows:
each capital call is assumed to be invested in a public market index (such as the S&P 500 or an ETF tracking the index) on the same date and for the same amount;
each distribution is treated as a withdrawal from the index on the corresponding date.
This allows the calculation of an internal rate of return (IRR) for the public market investment, which can then be directly compared to the IRR of the private fund. In other words, it’s a comparison of apples to apples.
Only that’s not the case.
In reality, with the PME method, we’re slicing oranges into the shape of apples, and then comparing those orange-shaped apples to actual apples.
Example
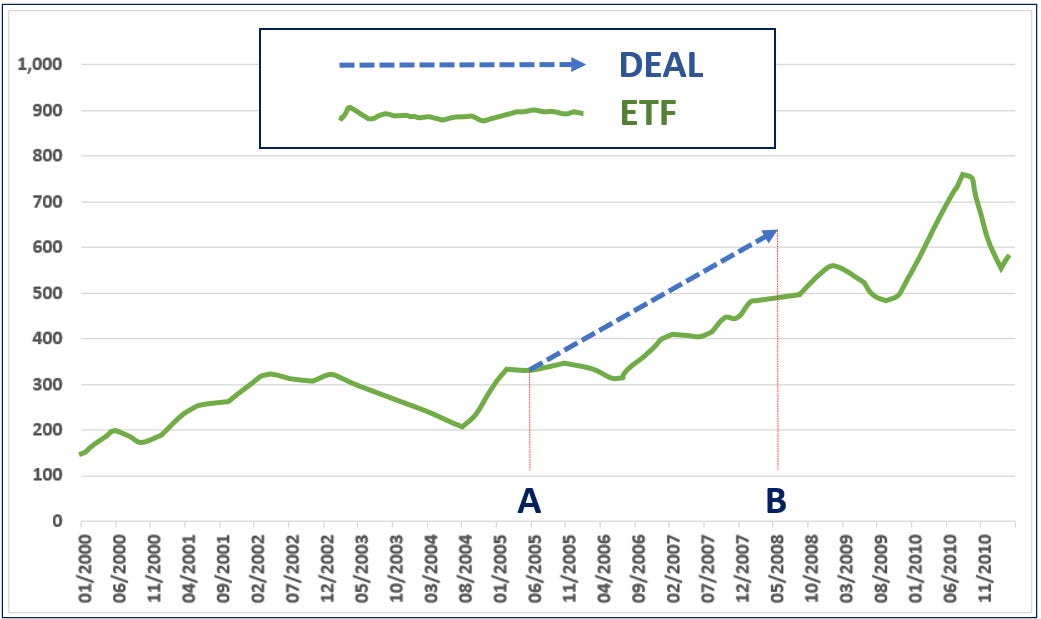
To simplify the discussion, let’s consider a closed-end fund that made only a single investment. The fund called $50 on date A and returned $95 to the investor on date B. The comparison between the investment in the closed-end fund (represented by the blue line) and an investment in an ETF (represented by the green line) can be seen in the following chart:
Well, the savvy investor who invested in the closed-end fund earned a 90% return over the period, while the ETF yielded only a 67% return during the same time frame (between A and B). In other words, the fund outperformed the ETF.
Here’s a post on why illiquidity premium is disappearing:
This elegant method, however, is flawed.
Here’s a conversation that took place between two runners: Mr. Private and Ms. General.
Private: Hey, what do you say we measure who’s the better runner? I don’t want to race, though. Let’s just use the results we already have.
General: Great idea. But how are we going to do that? We’ve never actually run in the same race.
Private: Did you run yesterday?
General: Yes.
Private: Great, me too. Yesterday I was feeling amazing around 2:15 PM. Super energized. The weather was perfect. So, I went out for a sprint starting at 2:20 PM. I ran for 16 seconds and covered exactly 120 meters. What were you doing at exactly that time?
General: I was in the middle of running a marathon. Barefoot. With a 20-kilo backpack.
Private: No, I mean exactly at 2:20 PM for 16 seconds.
General: During those 16 seconds I covered 30 meters.
Private: Ah, so I’m four times faster than you.
General: Uh-huh. And what did you do the rest of the day? While I was running a marathon?
Private: I wasn’t running. You can’t compare us during times when I wasn’t running.
General: Makes total sense.
The Investor POV
The investor’s decision wasn’t to invest $50 on date A and redeem on date B, even though that’s what ultimately happened.
The actual investment decision was something entirely different: the investor chose to commit $100 to a closed-end fund with:
a 4-year capital call period,
a 6-year harvesting period, and
up to two extensions of two years each.
If we want to compare that decision to an investment in a liquid (public) product, we need to define the comparison at the time of the decision—with all the uncertainty inherent in that choice. Not retroactively, once the fund’s actual cash flows are known and all the additional uncertainty associated with a closed-end fund investment has already disappeared.
The illusion of an “apples-to-apples” comparison in the PME method, arises because it mixes two distinct types of uncertainty:
Uncertainty about the future performance of both the public index and the private fund. This type of uncertainty is indeed shared by both investments at the time the decision is made. In that sense, there is an equality between the two products.
Uncertainty about the timing and amounts of capital calls, the timing of distributions, the percentage of the committed capital that will ultimately be called, and the total life of the fund including potential extensions.
This second group of uncertainties simply doesn’t exist when investing in an ETF. The investor can invest when they want, how much they want, and redeem whenever they choose (as long as the amount invested is not material relative to daily ETF trading volume).
PME completely ignores this structural asymmetry in flexibility and control, and by doing so, creates a false sense of comparability.
Example, Expanded
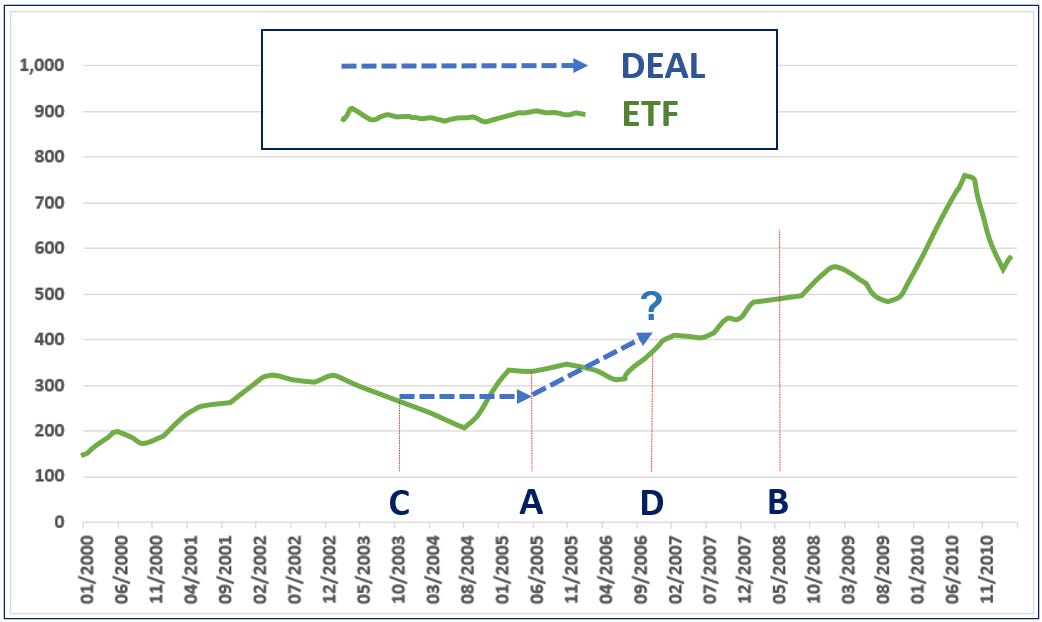
Comparing the investment between dates A and B on $50 is just as legitimate, as comparing an investment of $100, between points C and D.
For the sake of the argument, let’s assume the investor actually invested $100 in the ETF on date C and redeemed the entire investment on date D. We’ll now compare that decision to the investment in the closed-end fund over the same period (referring to the exact same fund and the same index described in the previous chart).
If we had invested $100 in the ETF on date C, we would have received $143 on date D, a return of 43% (represented by the green line).
What did the closed-end fund do between points C and D?
Let’s break its performance into two periods:
From C to A: the fund did nothing in terms of cash flow. It existed, and the fund’s team was likely reviewing potential investments, but from the investor’s perspective, there were no capital calls, no returns, and no cash flow activity.
From A to D: the fund rejected $50 of the investor’s capital (recall that only $50 was actually called out of the original $100 commitment). It invested just $50. Between A and D, that $50 was deployed, but as of date D, the fund was still invested—the investment was illiquid and not available for redemption. (NAV at D is irrelevant in this analysis because we’re focusing strictly on cash flow realizations, not accounting values).
Which investment is preferable according to this comparison?
One could argue, is it even reasonable to compare an early commitment to invest $100 in a closed-end fund with a spontaneous decision to invest $100 in an ETF? But that’s exactly what an ETF investment allows for: flexibility in both timing and amounts. And that’s precisely what a closed-end fund investment does not allow.
We can build a comparison based on the investment decision: to commit capital to a closed-end fund, for a long duration, with limited control over the amount and timing. Why would we evaluate performance based on the realized cash flow pattern of the fund—after all the extra uncertainty has disappeared?
Final Words
The ones who are going to kill the PME method are the managers of evergreen funds in the alternative investment space.
Once comparisons begin between a closed-end fund and its evergreen sibling, managed by the same firm, using the PME method, the evergreen fund will appear to underperform.
Ironically, it is the alternative asset managers themselves, those who elevated the PME method to a widely accepted and respected standard, who are now poised to bring it down.
About the author:
Hanoch Frankovits is a financial researcher specializing in applied investments, capital markets research, and financial modeling. He has extensive experience in capital markets across various roles, including: Head of Research at Buy-Side Partners, Head of Research at iFunds Capital (Alternative Investments), Head of Investment Research team at Bank Leumi, Chief Investment Strategist and Head of Investment Model Development at Videa.co.il (a robo-advisory firm), as well as advisor to family offices. His areas of expertise include asset allocation, investment analysis, portfolio risk management, and financial modeling.
Hanoch is an Israeli currently living with his family in France.
You can find him on LinkedIn (or via email at Hanoch-f@buyside-partners.com)


Some interesting deep thoughts here.
Brillant critique of PME—the runner analogy is especially clarifying. The fundamental flaw is that PME treats illiquidity as if it were merely an inconvenience rather than a first-order risk. When comparing private funds to public markets, we're essentially comparing apples (locked capital with uncertain timing and exit prices) to oranges (liquid capital with mark-to-market transparency). The expanded example showing how different time periods yield opposite conclusions really hammers home the point. What's particularly insightful is the observation about evergreen funds potentially exposing PME's limitations—as the private markets become more retail-accessible, these structural differences will become impossible to ignore. LPs deserve better benchmarking tools that actually account for the opportunity cost of capital lockup and the embedded optionality of liquid alternatives. Hanoch's point about PME ignoring "when" the investor could have deployed capital is the key insight many practitioners miss. Thanks for sharing this piece!