

Cliffwater Corporate Lending Fund (CCLFX) Faces Redemptions
A closer look at the fund’s off-balance-sheet CLOs, $11B in unfunded commitments, and regulatory limits (and what it all means)

Last December, I wrote about the Cliffwater Corporate Lending Fund, a $31.5B interval fund growing at 46% CAGR, raising capital so fast I compared it to the planet-eating monster from Star Trek, the Doomsday machine.
👉 If you missed the original deep dive, start here:

The pitch was simple: access to private credit, 9.5% annualized returns, 1% management fee, no performance fee (and no minimum investor qualifications). Capital was pouring in. The machine was eating.
Last week, the machine got indigestion.
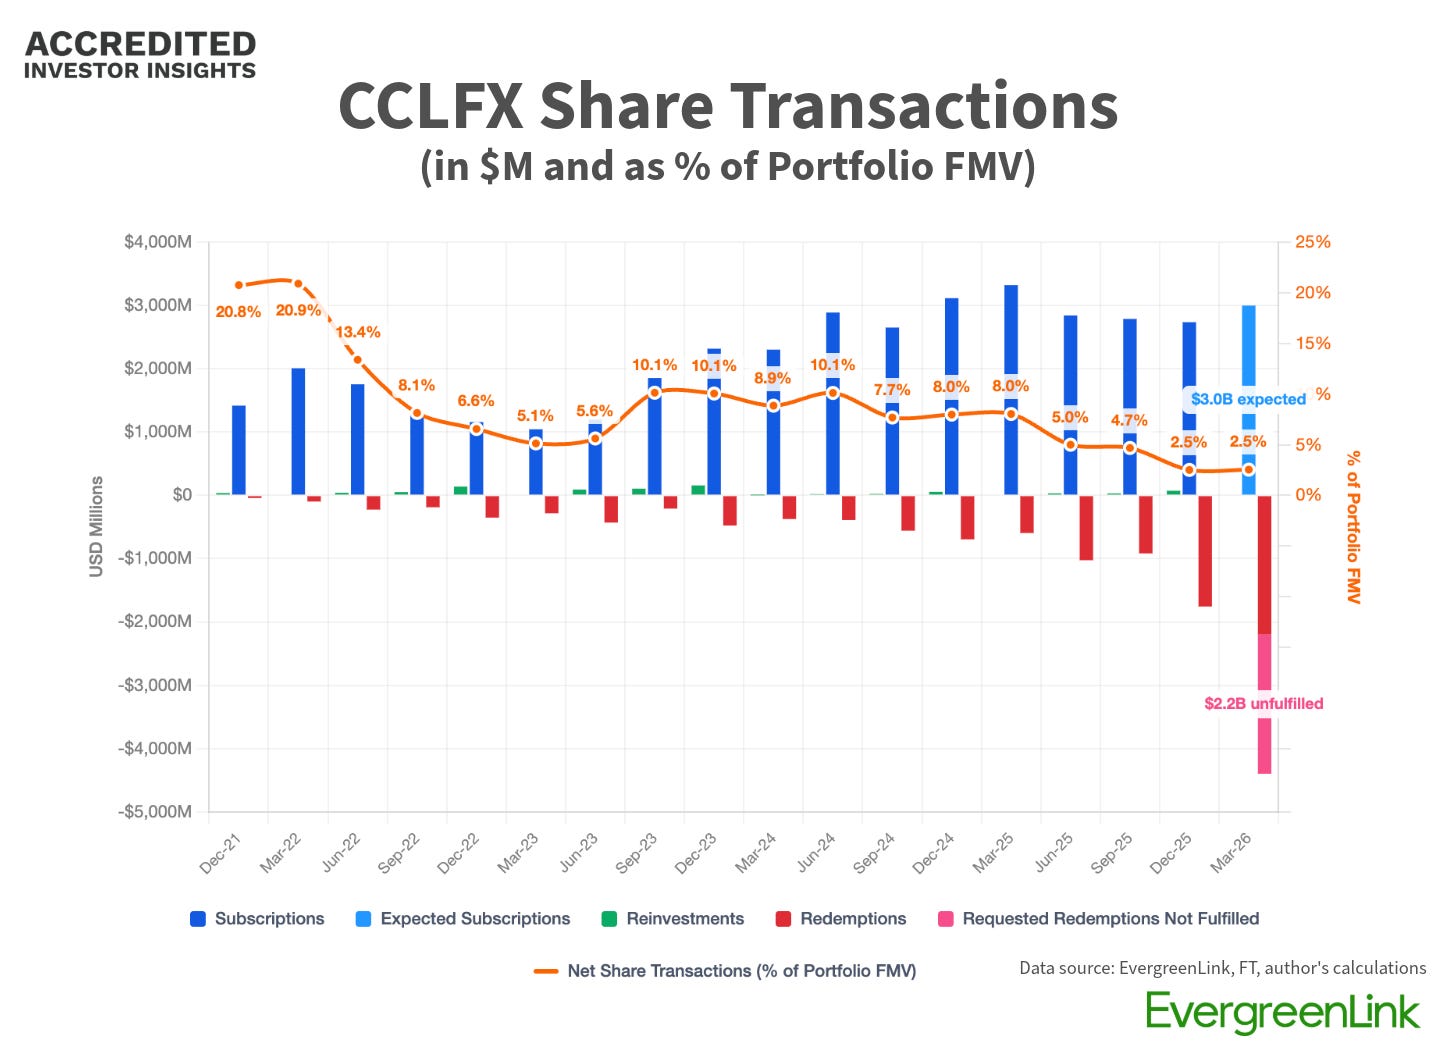
Bloomberg reported that investors requested redemptions of approximately 14% of CCLFX shares in Q1 2026. That’s a record for the fund.
Cliffwater capped repurchases at 7%. Half the investors who wanted out didn’t get out.
In a letter to shareholders, CEO Stephen Nesbitt said the fund’s performance “remains strong”: annualized return of ~9.4% since inception, a “historical track record of near zero percent in realized losses,” and liquidity at 21% of NAV.
I don’t doubt the return number.
What I want to do today is something different: I want to look forward. The fund expects ~$3B in new capital this quarter (per FT), which means Q1 is manageable: new shares in, old shares out.
👉 This younger sibling’s repurchase offer deadline is on 3/18. Something to watch..

But what happens if the new money slows down?
And the answer comes down to three interconnected factors:
The fund’s leverage (including off-balance-sheet CLO and PIV positions), and how reported leverage compares to the fund’s effective leverage
$11B of unfunded commitments
The regulatory leverage limit
Before we get any further, take a look at the inflows into the fund. The orange line is net share transactions as % of fund’s total fair market value (FMV), bars represent share transactions in $m.
Disclosure: This case study is provided for educational and informational purposes only and should not be construed as investment, legal, tax, or financial advice. The views expressed are solely those of the author. All examples are illustrative in nature and not guarantees of future outcomes. Readers should conduct their own independent research and consult with qualified professionals before making any investment or financial decisions.
Four Ways to Meet Redemptions
When an interval fund gets a redemption request, it has four ways to come up with the cash:
1️⃣ Cash on hand
2️⃣ New share sales (new investors in, old investors out, both at NAV)
3️⃣ Asset repayments and sales (selling loans or receiving paydowns)
4️⃣ Increasing leverage (borrowing more against the portfolio)
Let’s start with #1 and look at where the fund stood as of the last filing (September 30, 2025):
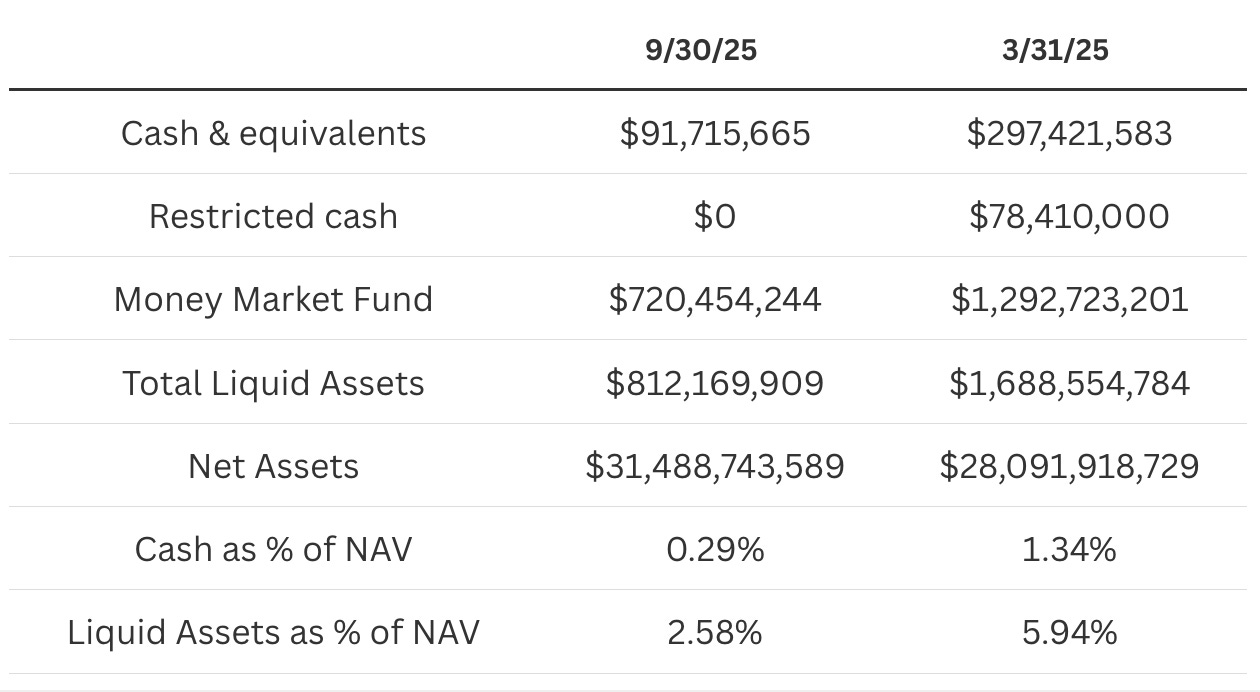
Translation: the fund ended September with $812M in cash and short-term securities on a $31.5B net asset base. That’s 2.58% of NAV.
That’s not going to cover a 7% repurchase on its own.
Source #2 (new share sales) is what’s keeping the fund liquid right now. The roughly $3B in expected Q1 inflows covers the 7% repurchase with room to spare. But this is the source most vulnerable to sentiment (I’m quoted in this WSJ article on this topic). If investors see a fund gating redemptions at 7% while 14% wanted out, the pipeline of new money may not look the same in Q2.
Source #3 (asset repayments and sales). Historically, the fund's portfolio has turned over at roughly 24% annually, which means ~$9.7B in natural loan repayments, refinancings, and sales per year (that’s ~$2.4B per quarter).
A 7% quarterly redemption is roughly $2.2B, so in theory, organic portfolio turnover alone nearly covers a max redemption quarter without the fund having to fire-sell anything.
But there are two catches:
24% is a historical average. In a tightening credit market, refinancing activity would slow, prepayments drop, and we can expect that $9.7B number to shrink.
Every dollar of repayment the fund uses to cover redemptions is a dollar it can't reinvest into new loans. That shrinks total assets, which brings us to the next point.
Watch liquidity, friends. I’m not kidding:

The Leverage Picture
Let’s talk about source #4, borrowing capacity.
Between March and September 2025, total borrowings jumped from $6.7B to $9.8B (a 45% increase in six months). During the same period, total assets grew 18.5%.
In other words, the fund was borrowing faster than it was growing.
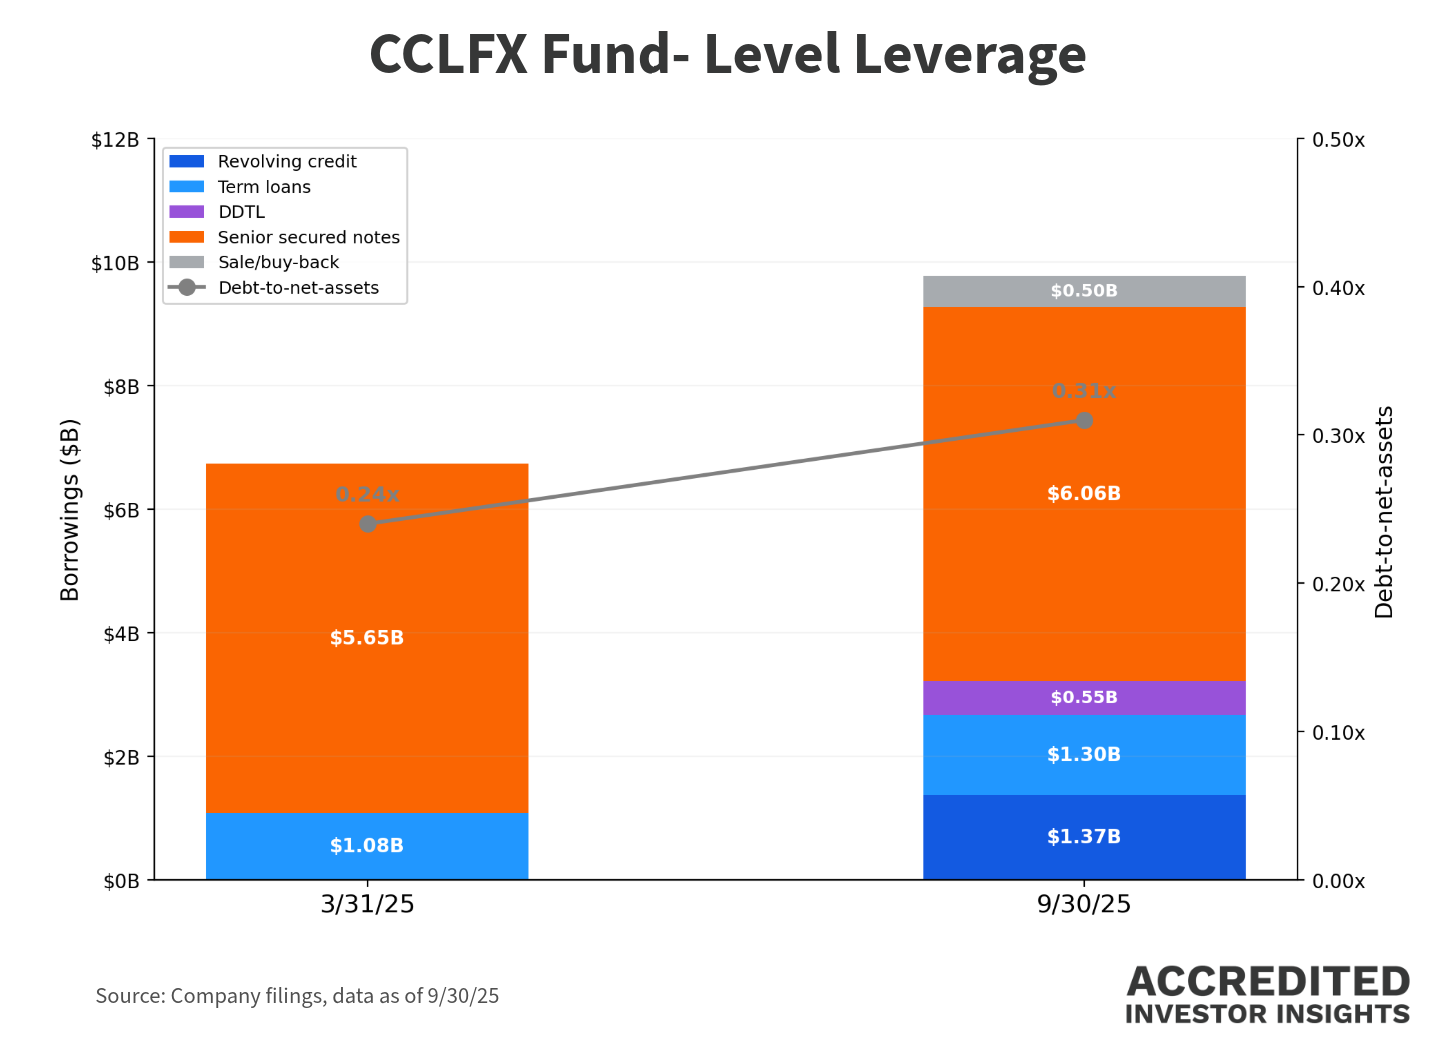
CCLFX maintains a senior secured credit facility to fund lending commitments and new investments. As of September 30, 2025: