

JLL Income Property Trust
What’s Inside and What It’s Really Worth

Happy Sunday!
If you missed the BPRE drama (a private evergreen fund listed on the NYSE last week, and opened 40% below NAV; yay for liquidity) - you can catch up in the FT and WSJ (and yes, yours truly got quoted in both, sorry couldn’t resist bragging). Or, if you prefer audio, check out this Talking Wealth podcast.
40% is nothing to sneeze at, and naturally, everyone is now wondering what discount to NAV their favorite non-traded fund would fetch if it hit the public markets. JLL Income Property Trust (JLLIP) came up in a casual conversation, and I thought it would make a great case study on how public markets might value its underlying assets. At the end of this post, there’s a poll, please cast your vote!

❗️There is a meaningful difference between this fund and BPRE: JLLIPT owns the properties directly. BPRE, being a fund-of-funds, owns stakes in other funds, giving it a more diversified portfolio. Otherwise, the two funds are similar in size and portfolio composition.
Another case study on a real estate fund-of-funds:

In today’s case study we will:
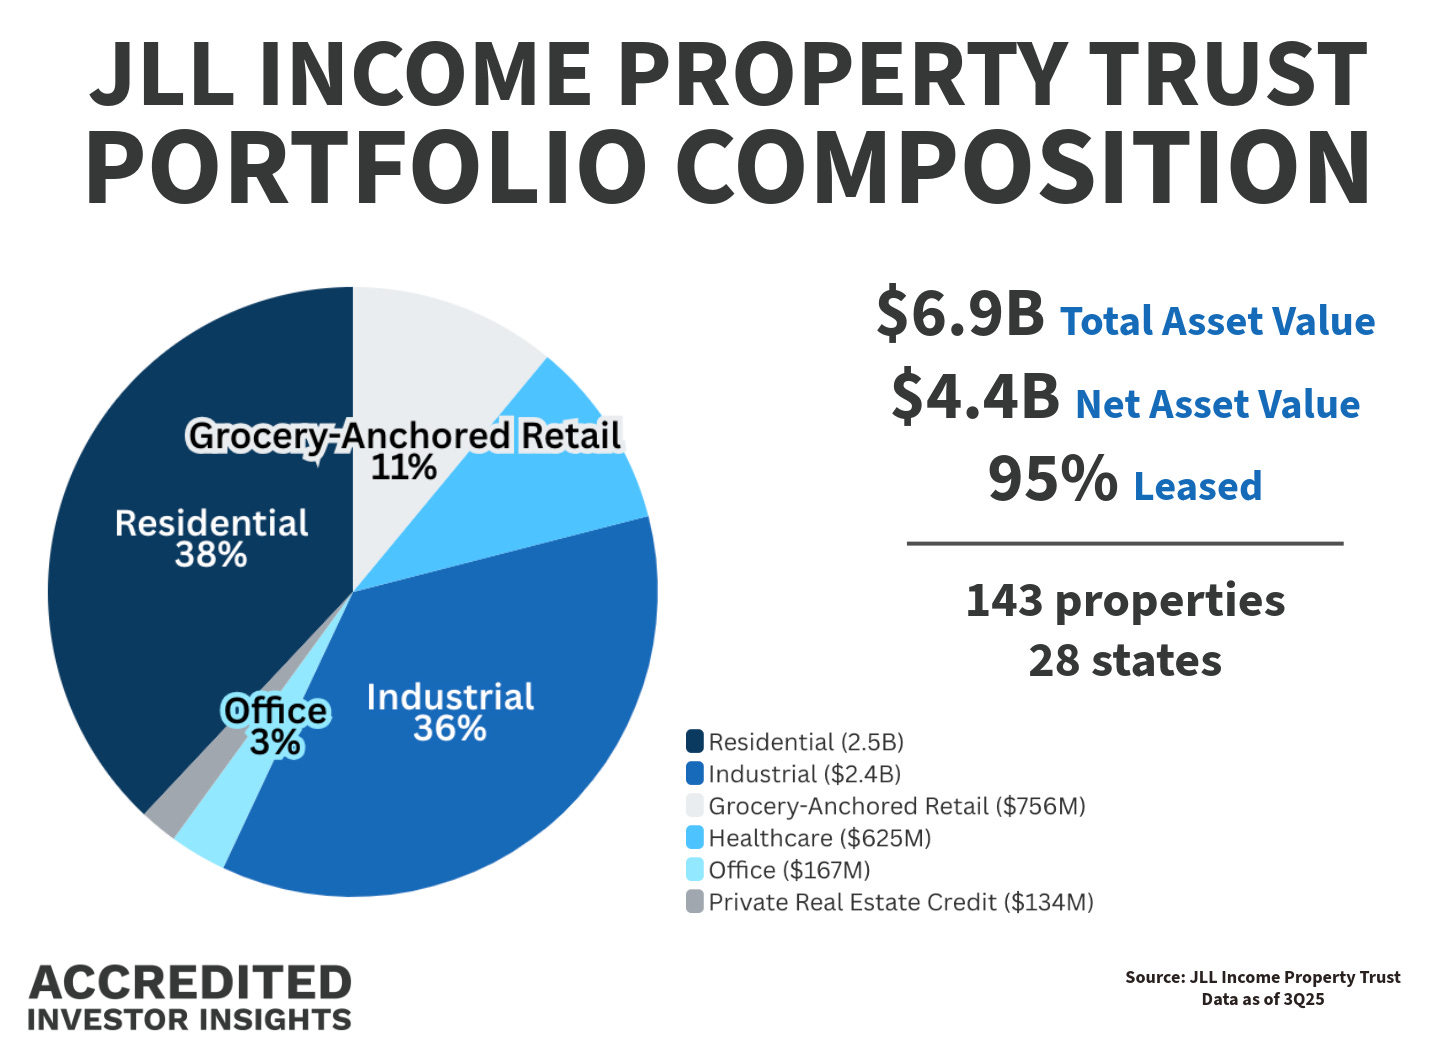
1️⃣ Look into what’s in the fund
2️⃣ Figure out where the headline distribution comes from
3️⃣ Calculate implied cap rate (this required digging through two separate docs posted in two different places)
🤓 Bonus for fellow nerds: Quick note on how DST shows up on the balance sheet
Disclosure: This case study is provided for educational and informational purposes only and should not be construed as investment, legal, tax, or financial advice. The views expressed are solely those of the author. All examples are illustrative in nature and not guarantees of future outcomes. Readers should conduct their own independent research and consult with qualified professionals before making any investment or financial decisions.
The Pitch
📌 Before we get to the good stuff, I need to tell you something important. For your own good, if you want to understand private market funds, get comfortable reading documents full of numbers. More numbers = *usually* more useful. Almost always the inverse is also true: the prettier the presentation, the fewer meaningful details you’ll find in it. I don’t make the rules.
Case in point: JLLIP’s quarterly investor presentation listed on the fund website is gorgeous. Unfortunately, it has very few numbers. To get the real data, you’ll need to pull the actual quarterly report from the SEC website (here’s the link, you are welcome).
Ok, off my soapbox.
JLL Income Property Trust (JLLIPT) is a non-traded, daily-valued perpetual-life REIT that owns a diversified U.S. real estate portfolio.
Externally managed by LaSalle Investment Management, an SEC-registered advisor and JLL subsidiary
No employees; LaSalle handles investment decisions and day-to-day operations
JLL and affiliates hold a meaningful equity stake in the REIT
Advisory Fees
1️⃣ Fixed Fee: 1.25% of NAV per year
New share classes (S, D, Z, I) launched Oct 7, 2025: 20% fee waiver through Dec 31, 2026 (reducing it to 1.0%)
2️⃣ Performance Fee: 10% of total return above a 7% annual hurdle, calculated annually
As of 9/30/25: no performance fees earned
💰 As of 9/30/25, the fund reports a 5.6% annualized distribution rate.
👉 Oh, wait, here’s another non-traded REIT, a small one yet:

Liquidity
JLLIPT is non-traded, so liquidity is limited:
After a one-year holding period, shares can be submitted for repurchase daily
Redemptions capped at ~5% of NAV per quarter and 20% per year
Repurchases done at NAV, not market price
Board can modify or suspend the program at any time
✅ Good news: for the nine months ended 9/30/25, the fund honored 100% of repurchase requests, repurchasing ~$291M worth of shares (~25M shares). That’s encouraging, but for investors in evergreen vehicles, redemption activity is a metric worth watching closely. Here’s why:

How the Money Is Made
Before we get to the (dare I say shockingly low?) implied cap rates, let’s take a look at the income statement: