

PE Fees Fall, Exodus from Non-Traded BDCs? and Distress That Isn’t
🗞️ Sunday digest: private markets insights 1/11

Happy Sunday! Every other week, we send a quick digest on what’s catching our eye across private markets.
Today’s lineup:
1️⃣ Private equity: fees hit a new low & continuation vehicles surge
2️⃣ Private credit: investor exodus from non-traded BDCs
3️⃣ Commercial real estate: where did distress go?
Before we dive in:
Accredited Insight delivers the LP’s perspective on private credit, private equity, and CRE, drawing on hundreds of deals, and thousands of conversations. Paid subscribers gain access to our database of over 30 case studies and articles on everything from evergreen funds to due diligence.
1️⃣ Private Equity
Has the balance of power shifted toward LPs? Even just a little?
Private equity management fees hit a new low in 2025. According to Preqin, buyout funds raised last year charged an average management fee of just 1.61%, well below the industry’s long-standing 2% norm (and the lowest ever recorded).
The decline reflects a tougher fundraising environment, with many managers offering concessions to secure commitments, even as total capital raised remained roughly in line with 2024.
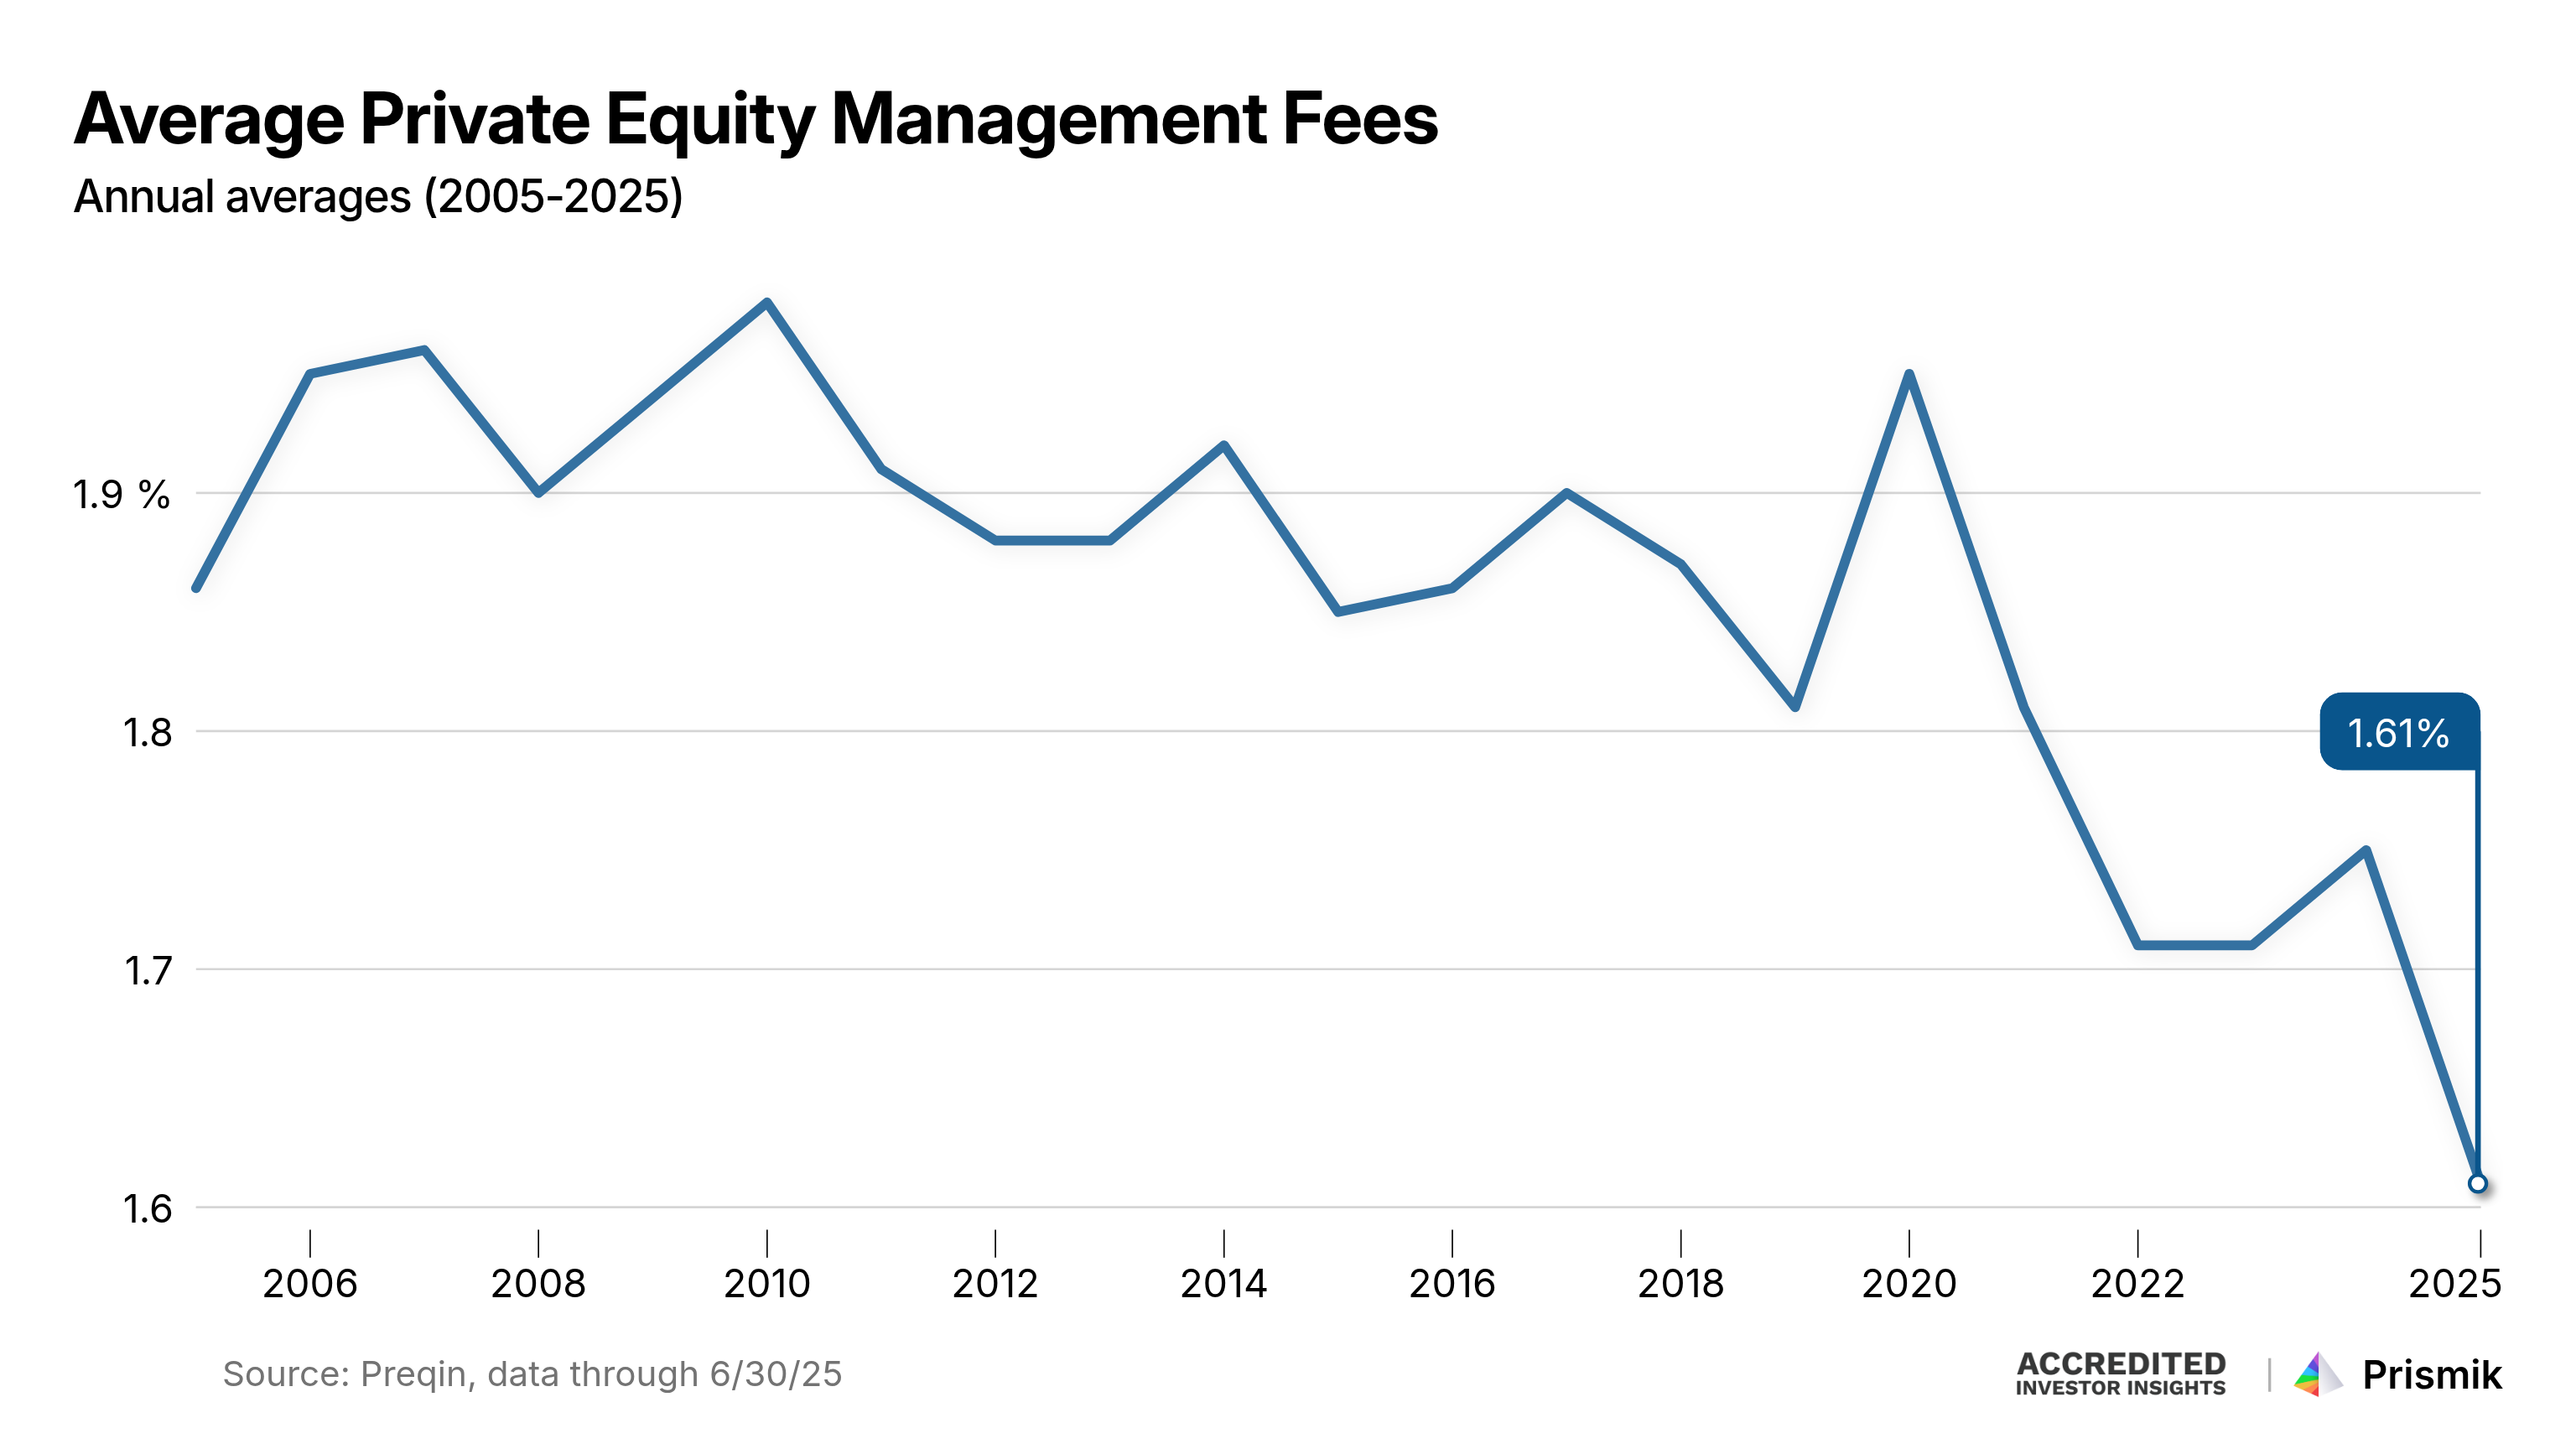
There is another dynamic at play: scale. Nearly half of all capital raised in 2025 went to the 10 largest funds, allowing mega-managers to spread fixed costs across bigger asset bases and charge lower headline rates without sacrificing fee dollars. Smaller and middle-market funds, by contrast, remain closer to 2%.
Incentive fees remain constrained due to muted exits, though expectations are building that realizations (and carry) could rebound in 2026 if rate cuts and narrower bid-ask spreads revive deal activity.
On waterfalls and incentive structures:

➡️ Another notable trend: continuation vehicles (CVs). In 2025, roughly 1 in 5 PE asset sales involved a new fund managed by the same firm buying assets from older funds, up from 12–13% the year before, according to FT. Raymond James and Jefferies estimate these transactions will hit close to $100 billion, a record.
CVs give older funds liquidity and flexibility, but conflict-of-interest concerns remain. The same GP sits on both sides of the transaction, collecting new fees while setting the transfer price. Firms argue pricing is validated by incoming investors and existing LPs can roll their stakes, but some institutional investors remain uneasy.
♲ Read the CV primer here:

2️⃣ Private Credit
After years of record fundraising, private credit is now facing a liquidity test as investors pull back from non-traded business development companies (BDCs).
Remember the Blue Owl OBDC II debacle?
👉 If you missed it, you can catch up here:

Blue Owl made headlines again , - this time with another non-traded fund, - after allowing investors to withdraw up to 17% of the vehicle, well above its standard 5% quarterly limit.
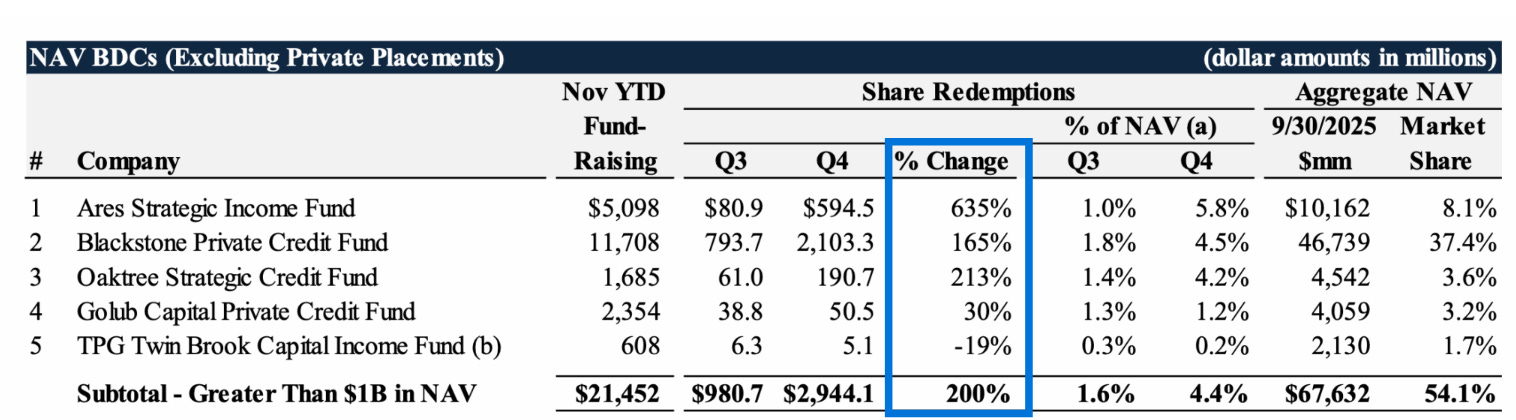
Other managers are seeing meaningful capital outflows: the Ares Strategic Income Fund, for example, reported a 635% quarter-over-quarter increase in redemption requests.
Across the market, the trend is clear. In Q4 2025, redemption requests from non-traded BDCs with more than $1 billion in assets surged 200%, totaling nearly $3 billion (note: many BDCs have not yet reported Q4 results).
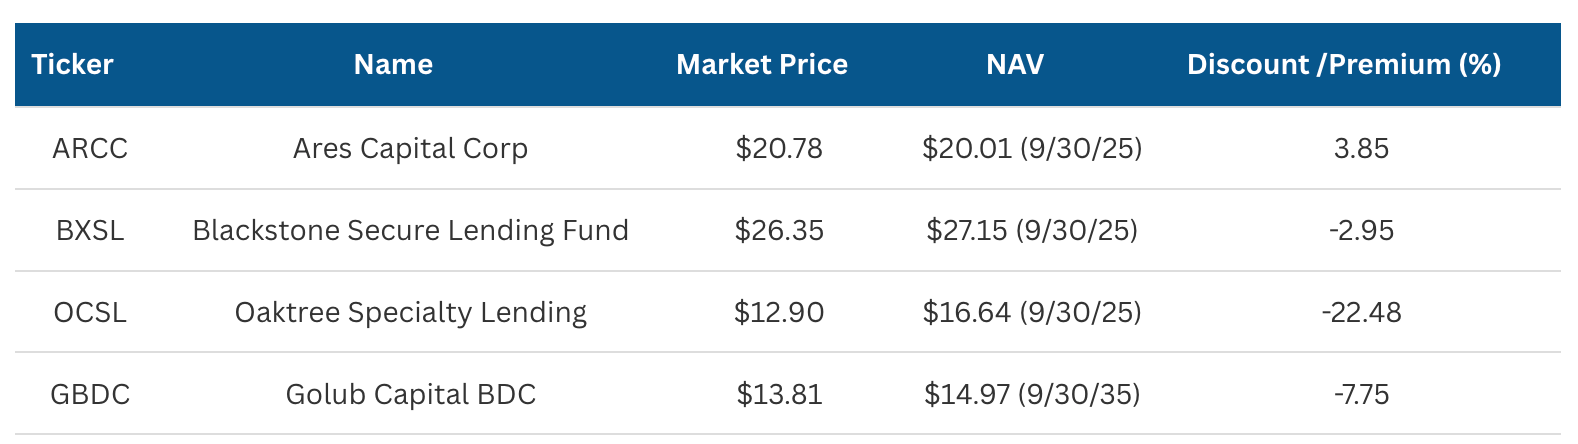
For context, below is a snapshot of discounts to NAV (as of 1/9/2026) for public BDCs run by the same four managers above that also operate listed vehicles:
Despite the rise in redemptions, fundraising remains resilient. BDCs are still on track to raise over $60 billion in 2025, according to Stanger, including more than $40 billion from registered offerings.
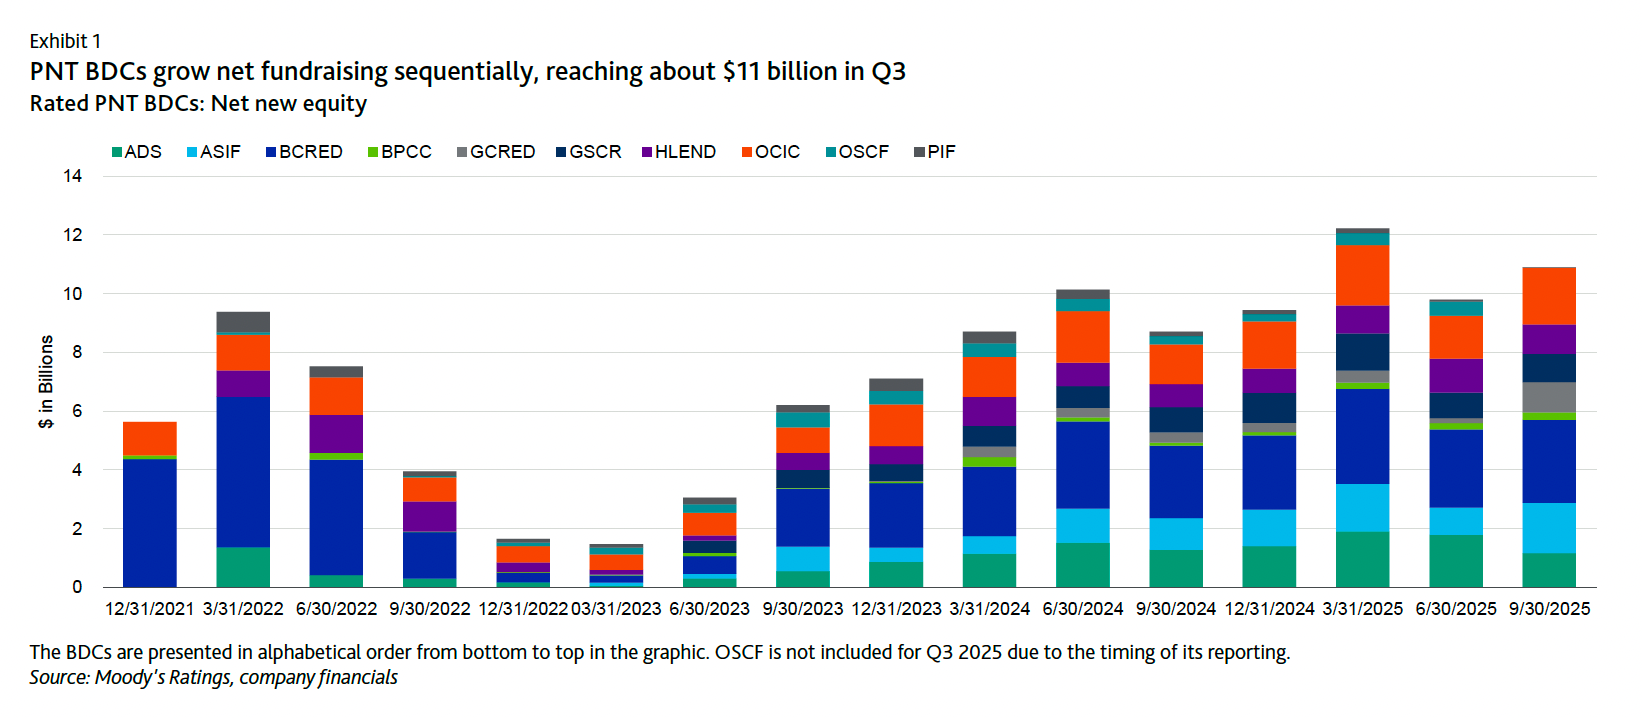
Here’s Moody’s data through Q3 2025 (PNT = perpetual non-traded):
👉 Invest in private credit? Read this:

And finally, updated PIK info from Moody’s:
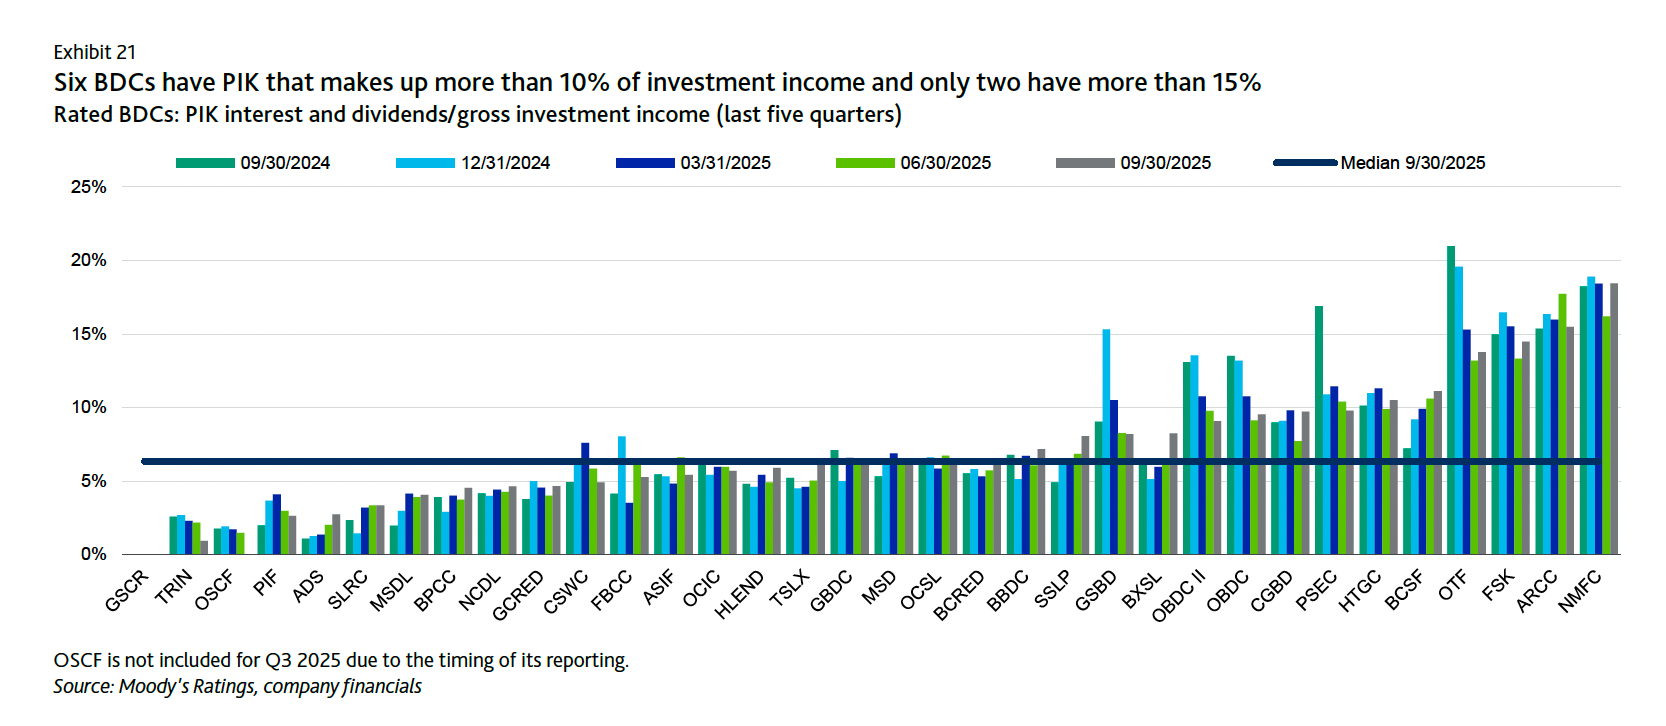
“PIK the can down the road”, as one of my internet friends says. Here’s why tracking PIK is important:

3️⃣ Commercial Real Estate
This cycle’s lack of visible distress is the function of who sits at the capital table. According to MSCI, distressed asset sales accounted for just ~3% of total transaction volume through mid-2025, compared with roughly 20% three years after the GFC. Prices have also fallen far less (peak decline ~10% vs 23% in 2009).
➡️ One key difference: the rise of private real estate debt funds, which have increasingly replaced banks as lenders, introducing flexible, less-regulated capital into the system
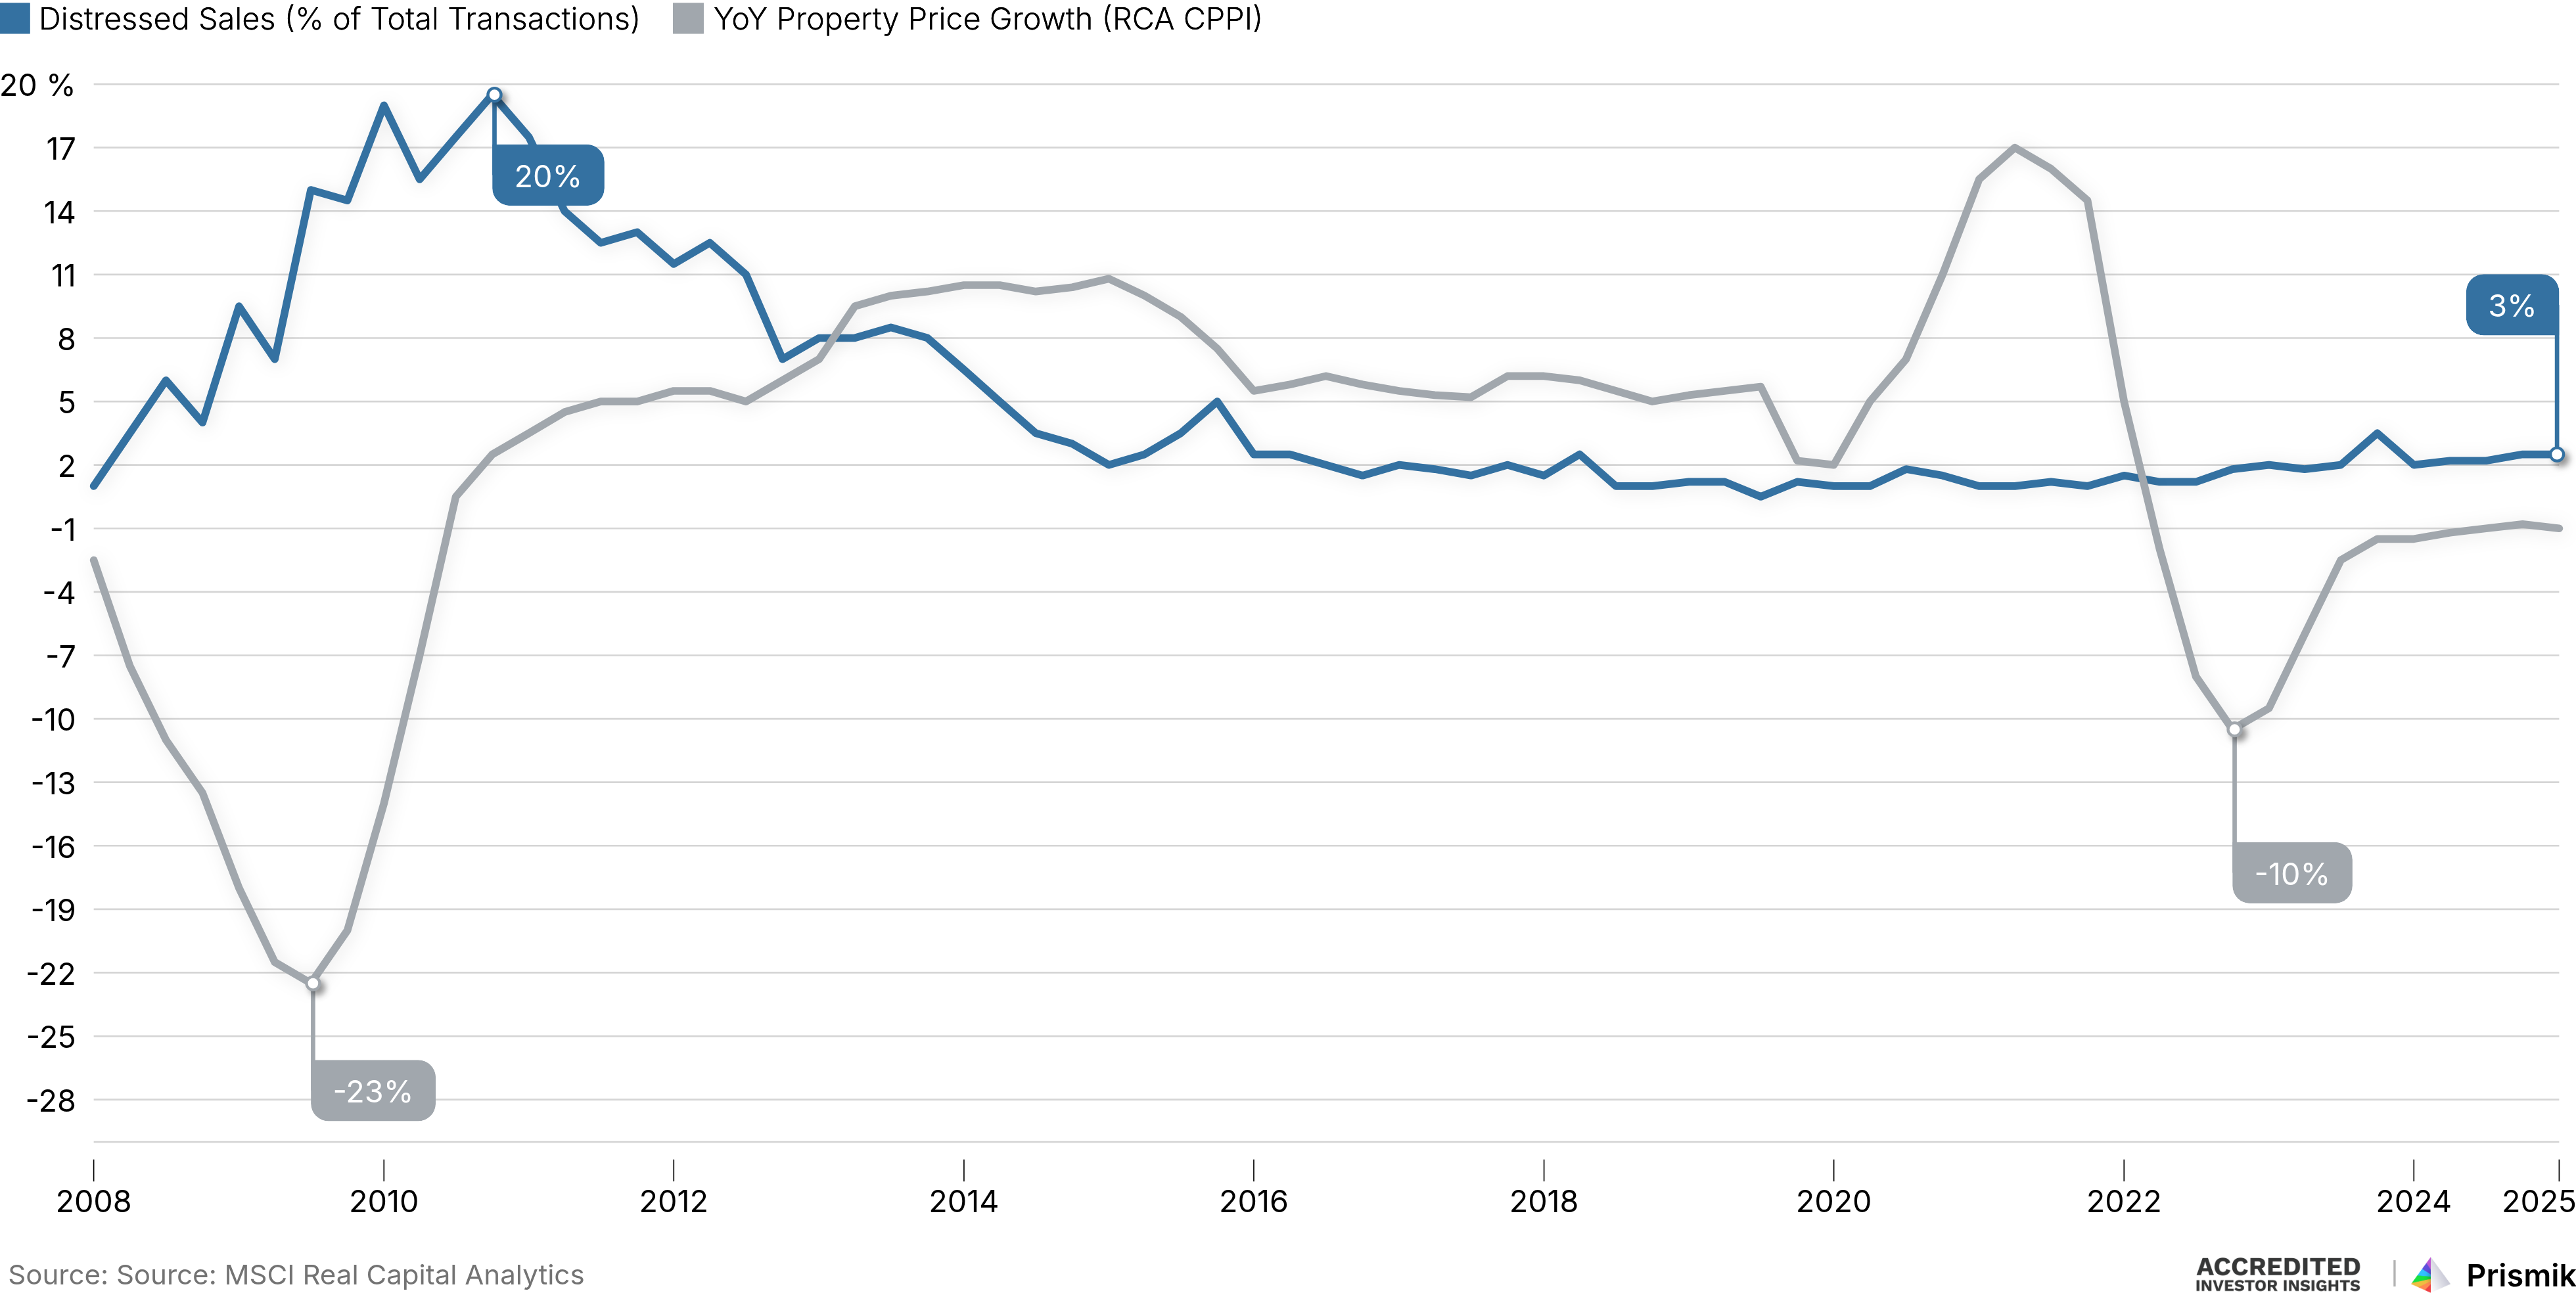
Rather than forcing foreclosures, debt funds (especially mezzanine lenders) have enabled borrowers to add leverage, extend maturities, and delay losses (aka “extend and pretend”).

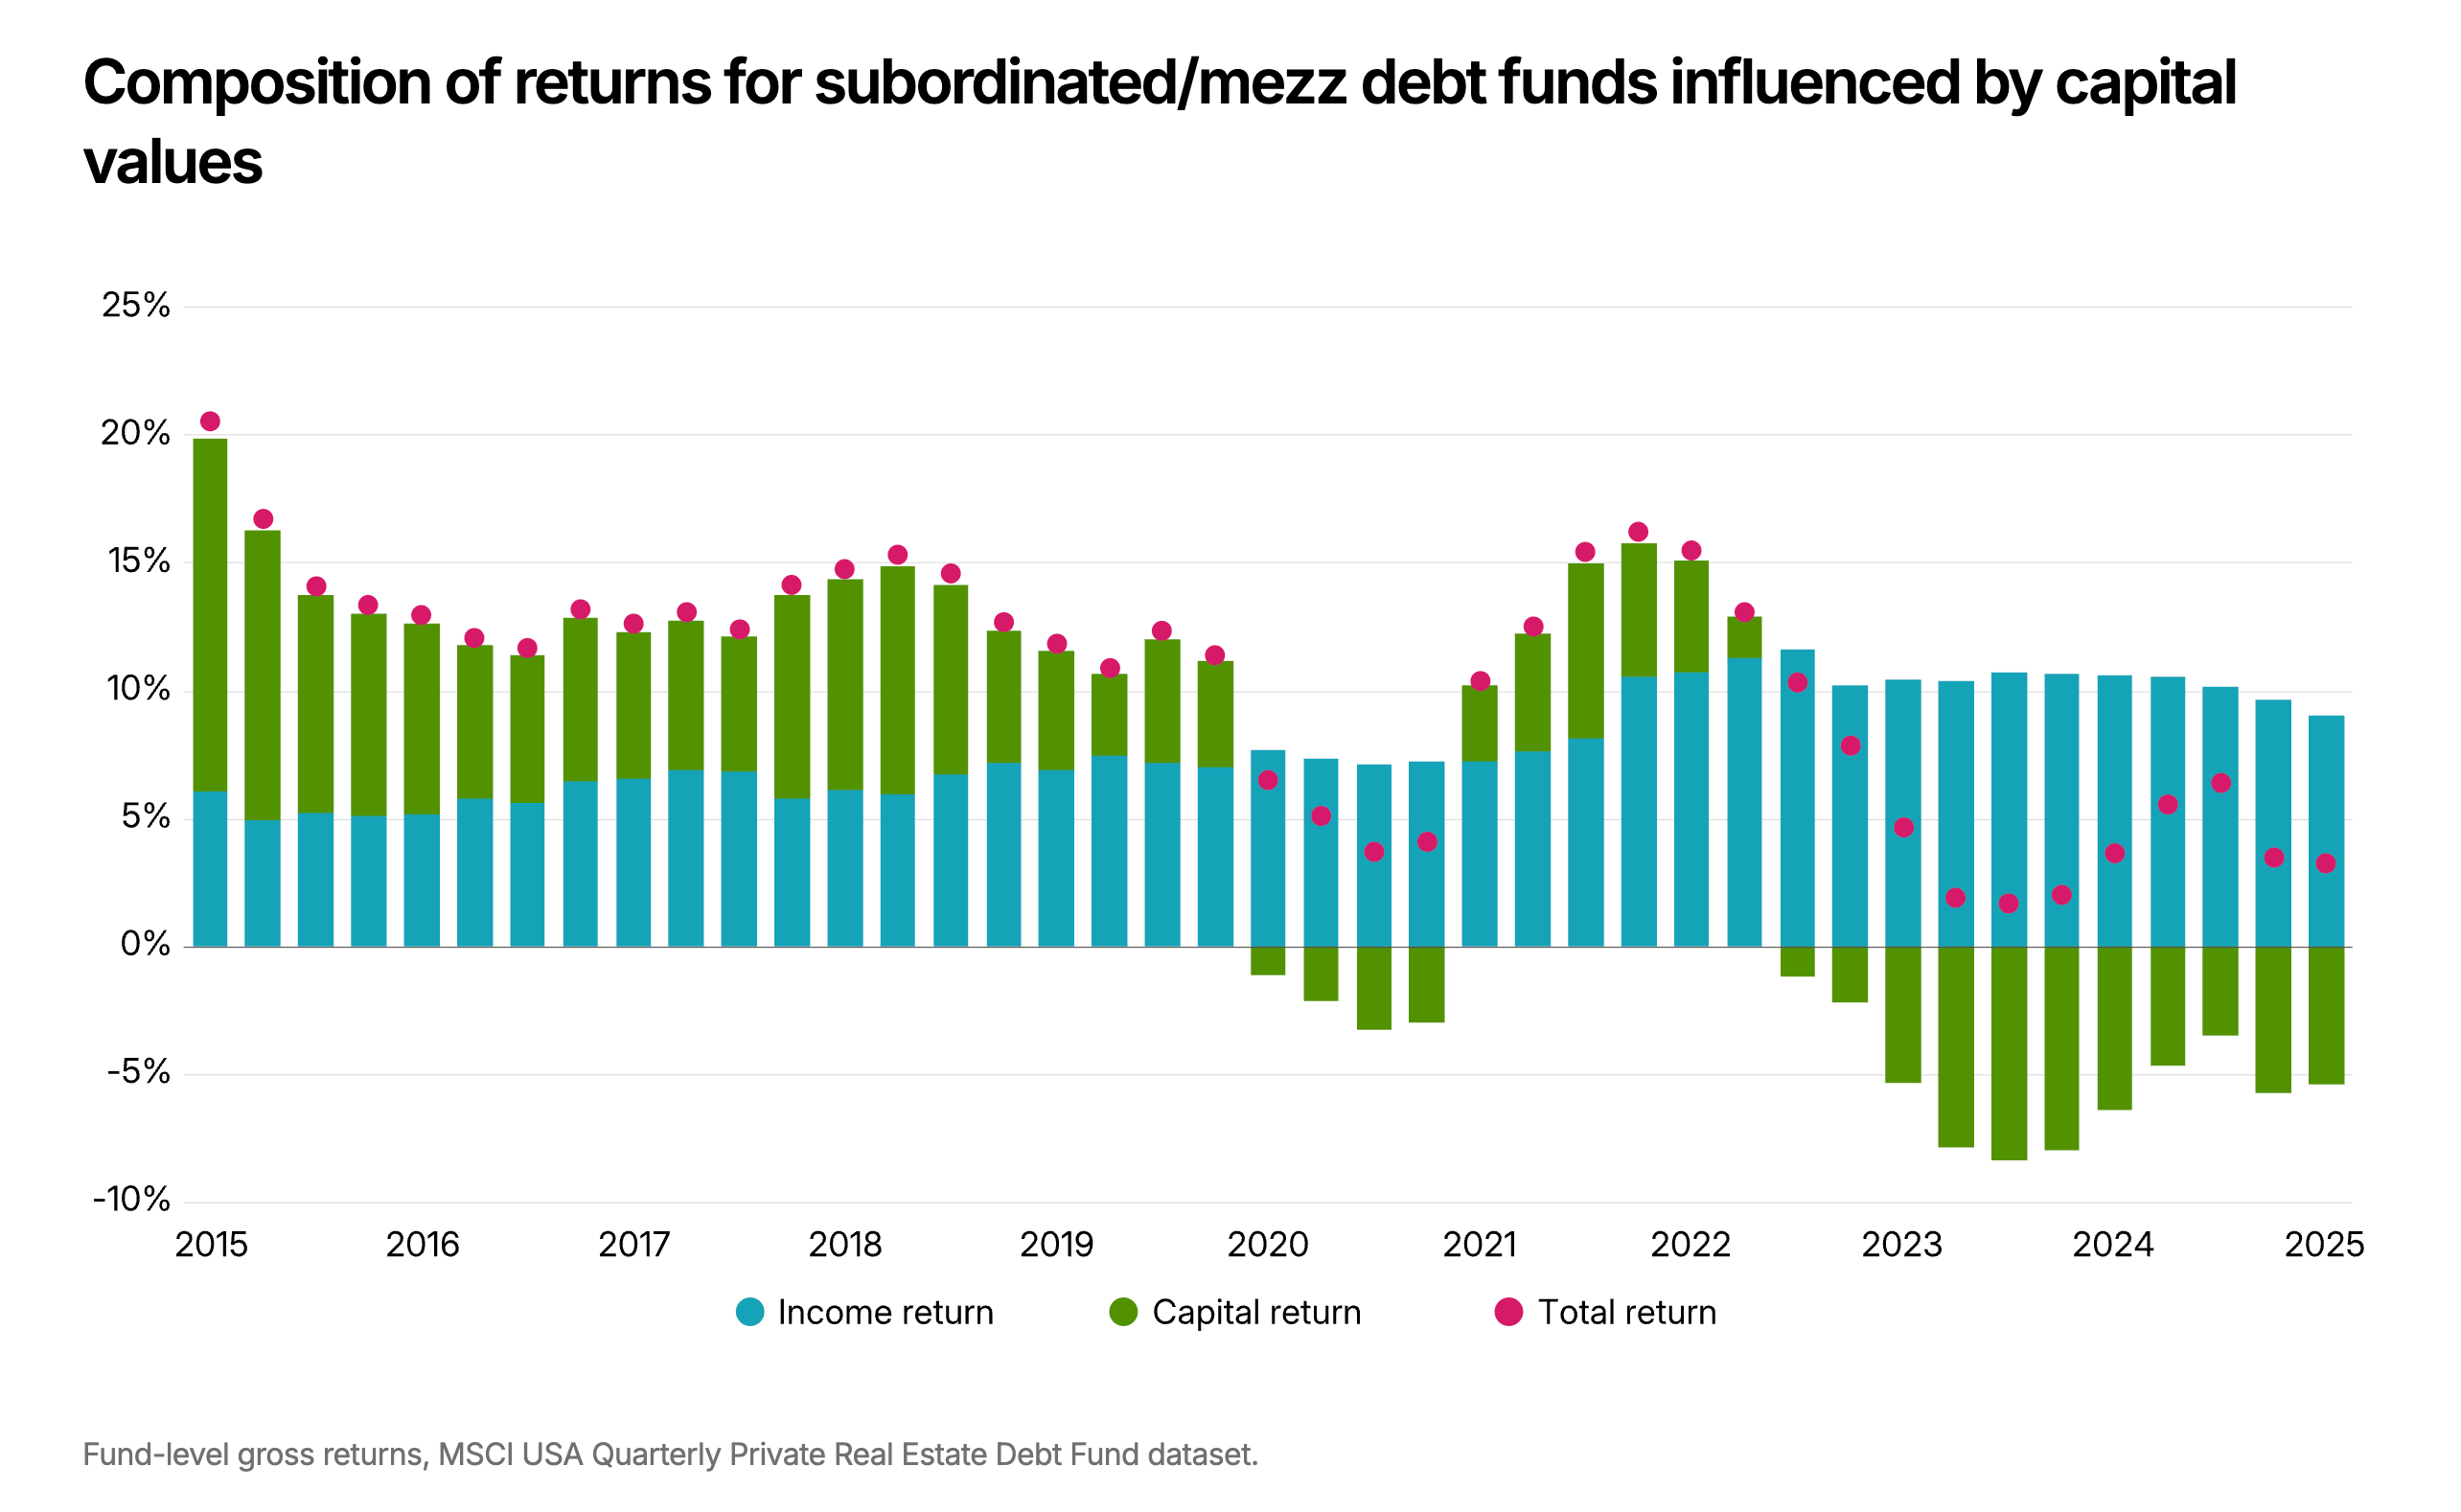
Mezzanine-focused debt funds have seen consistent declines in capital returns, driven by a mix of realized losses on bad loans and unrealized mark-to-market declines.
“To the extent that recent price declines translate into realized losses, they are less likely to result in the protracted, contested foreclosures that followed the GFC. Mezzanine lenders, through their interests in the LLCs that control a property, gain meaningful control rights upon default, allowing them to influence outcomes more directly.” - MSCI
New here?
Check out some of our popular topics to get started: on private credit, private equity, and commercial real estate.
Thanks for reading! As always, if you have any suggestions, reply to this email, leave a comment, or find me on socials (X and LinkedIn)
-Leyla
What about str - the new tool banks found to layoff risk weighted assets ...was this covered here?
Interesting about the sell off of non traded debt funds. I wonder how it affects Cliffwaters NAV and if their pricing for new buyers will stay the same