

The Equity Cushion Illusion
Why LTV is an incomplete measure of risk in private credit

This chart has been making the rounds lately. It shows that equity contributions in leveraged buyouts have risen steadily, reaching 52% by 2023, and still sitting at near-record highs.
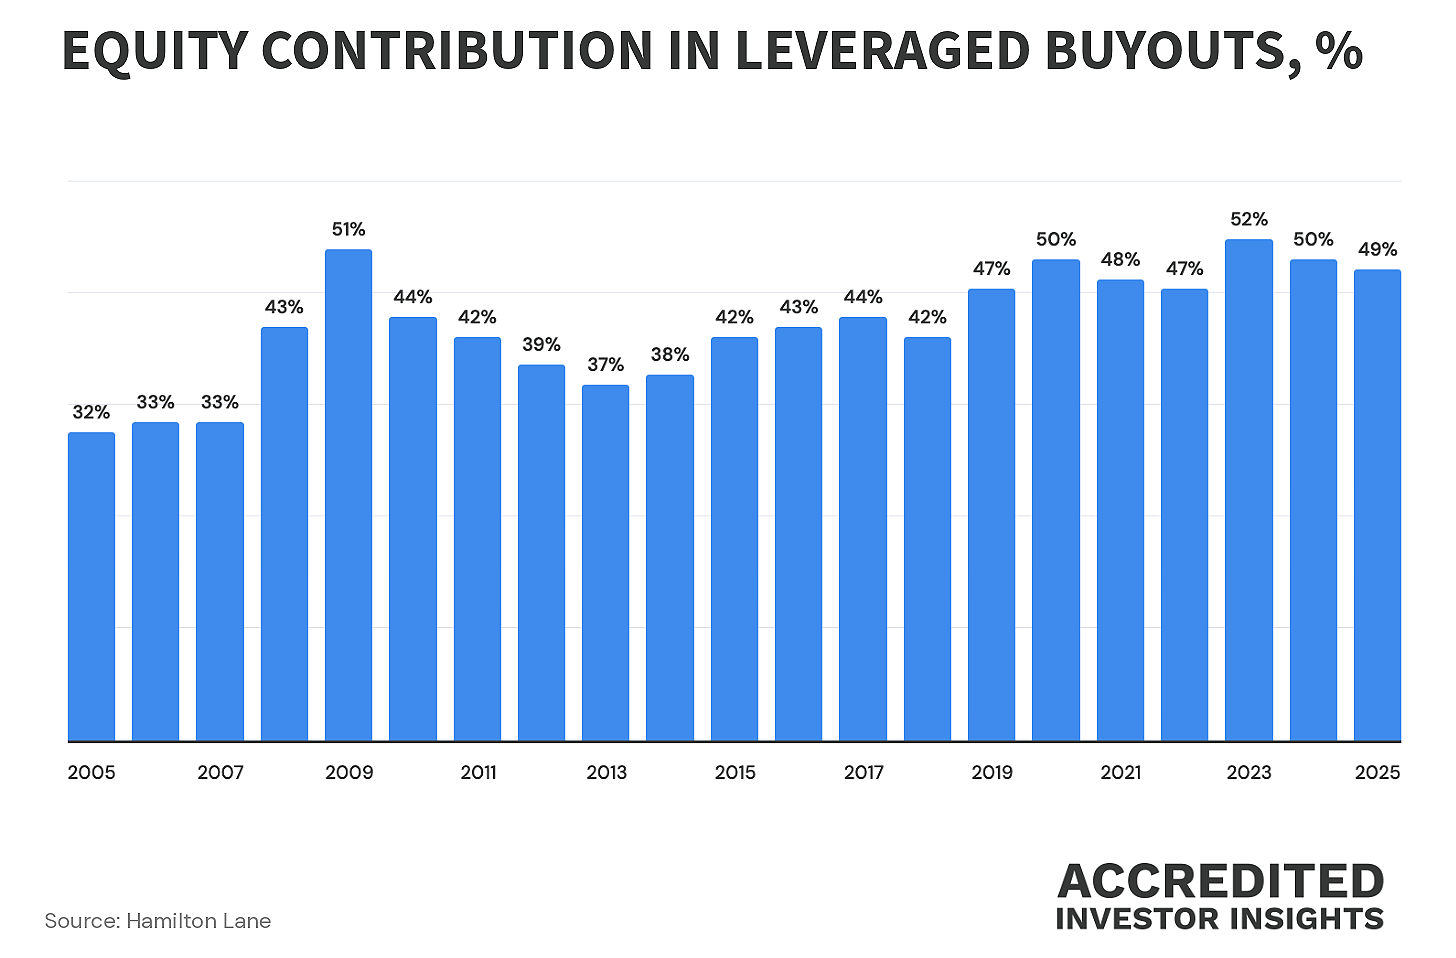
The read is reassuring: sponsors are putting in more equity than ever. Lenders are protected. Private credit is disciplined.
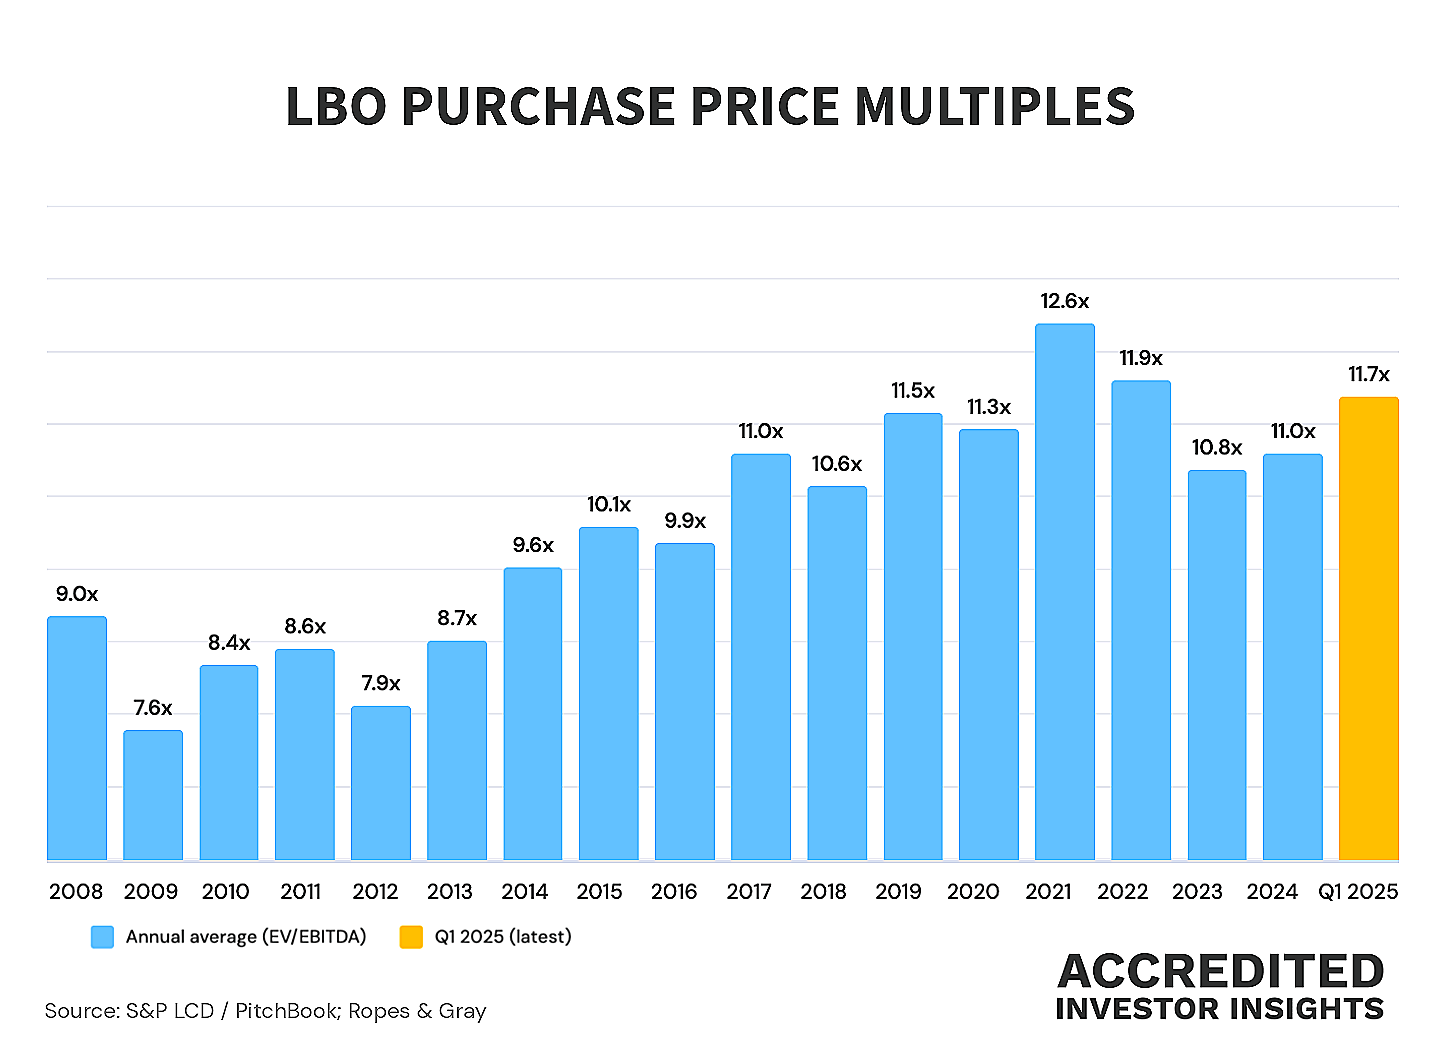
But take a look at the second chart. LBO purchase price multiples have risen to roughly 11x EBITDA, also near historic highs.
Today, I’ll make the case for why LTV is an incomplete (and often misleading) metric for evaluating private credit fund portfolios when used on its own.
More specifically: in middle market lending, where “collateral” is often enterprise value rather than hard assets, headline LTV ratios can look safer even as borrower fundamentals weaken.
❓“Leyla, where do I find all this?” - the first place to look is financial statements. Start here:

We’ll look at what the math actually tells us about lender risk, using filings from two funds: Cliffwater’s Corporate Lending Fund (CCLFX) and Goldman Sachs Private Credit Corp (GSCR).
👉 If you missed the deep dive on Cliffwater’s CCLFX, you can read it here:
And GSCR was discussed here (as a comparison to GSBD), and is probably worth a deep dive of its own (stay tuned):


The Anatomy of Risk: Leverage vs. LTV
A long time ago, I was taught the three C’s of lending: collateral, capacity, and character.
Collateral refers to the value of the asset securing the loan
Capacity refers to the borrower’s ability to repay
Character is self-explanatory (the softest metric of the three, and the hardest to gauge).
When it comes to loans to middle market portfolio companies backed by PE firms, character can largely be set aside (since you can’t assess credit history in the way you would for a consumer or public corporate borrower).
🧮 But we can do the math behind the two remaining C’s: collateral and capacity.
To understand the risk, we must first separate two concepts that are often conflated. The terminology doesn’t help, because "leverage" and "LTV" intuitively suggest the same thing.
They are not the same thing. (I don’t make the rules).
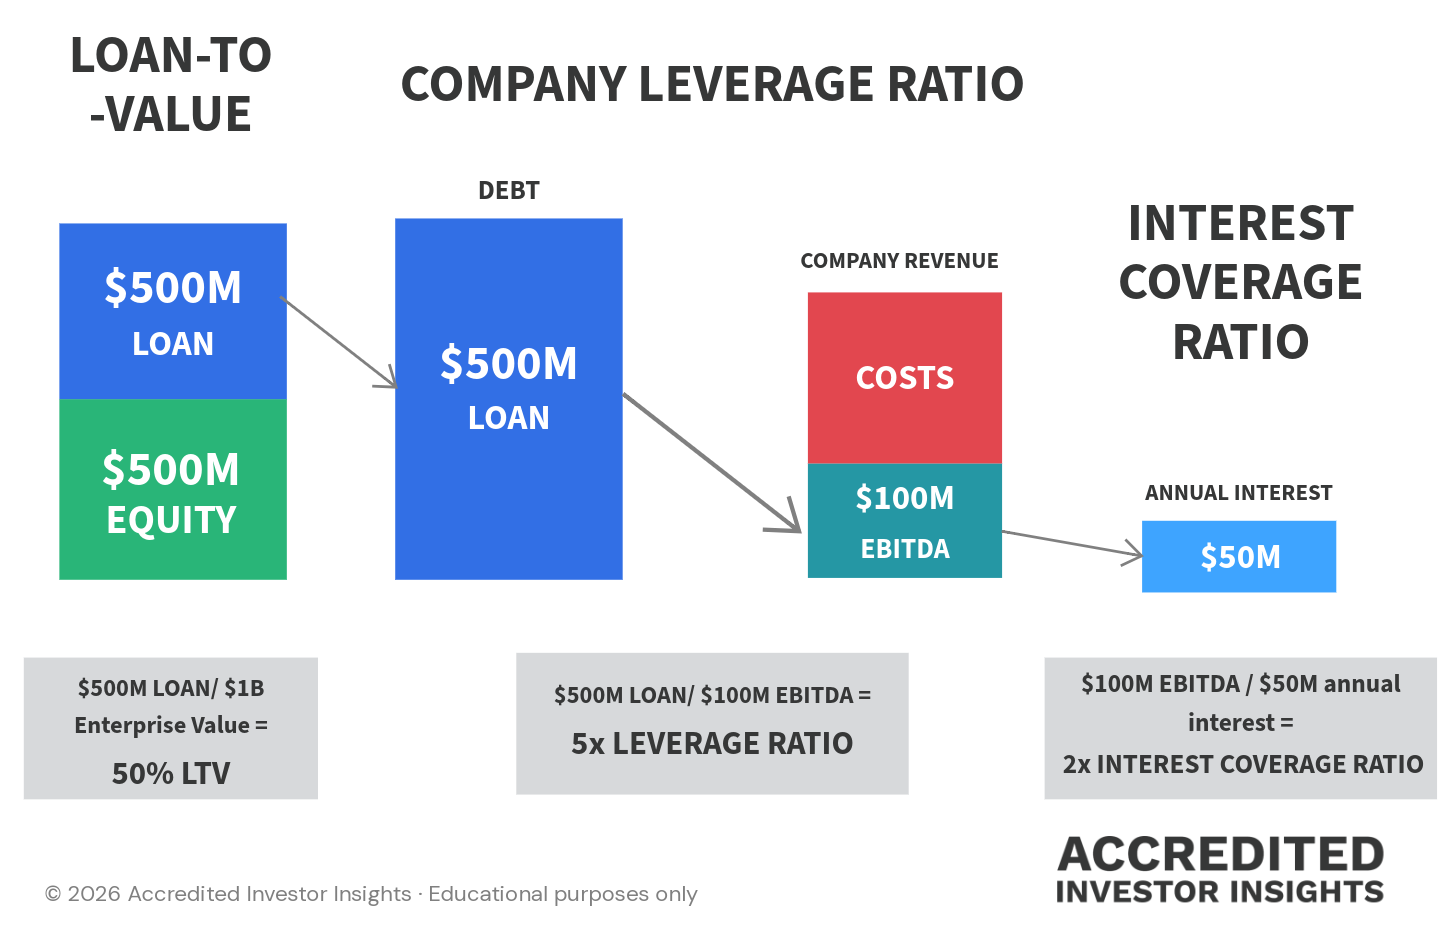
We’ll start from the left of this graphic:
LTV (the collateral metric):
This tells you what percentage of the company’s total worth is encumbered by debt. It tracks the equity cushion (what’s left for the lender if the business has to be sold).
In theory, bigger cushion = more protection.
‼️VERY IMPORTANT CAVEAT (with 2!! exclamation points): the difference between middle market lending and, say, a real estate loan is that there is no hard asset backing the debt.
A mortgage lender can foreclose on a building. In middle market private credit, the “collateral” is the company’s earning power (EBITDA, its customer contracts, its management team, etc). If earnings fall, the collateral falls with them, simultaneously and in the same direction. There is no building to sell. There is only a multiple applied to a cash flow stream, and both the multiple and the cash flow can compress at once.
The “cushion”, folks, is not a hard asset. It is an assumption on top of another assumption: what the market is willing to pay for a stream of earnings.
Leverage (the capacity metric) - middle of the graphic above:
In simple terms, leverage tells you how many years of earnings it would take to repay the debt if all free cash flows were directed toward repayment.
The higher the number, the longer it would take to repay, and the riskier the loan.
Unlike LTV, leverage does not depend on what someone else is willing to pay for the business. The metric is rooted in operating performance (as EBITDA goes up, leverage ratio improves, and vice versa).
👉 Speaking of private equity returns, read this:

Interest Coverage (the cash flow metric):
This is the most immediate and, arguably, the most important metric: