


Happy Sunday!
Two years ago, CRE CLOs held the largest share of delinquent securitized multifamily debt.
Today, private-label CMBS holds half of it, despite accounting for just 12% of the outstanding balance.
Total delinquent balances climbed from $7.0B to $11.6B over the same period.
The distress is still there, and the CRE CLOs that look like they’ve cleaned up their act deserve an asterisk. (More on that below. Private markets do love an asterisk)
In this issue:
1️⃣ Private Credit: Apollo marks daily, the same loan gets different values depending on who holds it, and non-traded BDCs paid out more than they raised.
2️⃣ Private Equity: General Atlantic sells a continuation vehicle to a continuation vehicle 🫠
3️⃣ Commercial Real Estate: where multifamily distress is moving.
Accredited Insight delivers the LP’s perspective on private credit, private equity, and CRE, drawing on hundreds of deals reviewed, and thousands of conversations. Paid subscribers gain access to our database of over 40 case studies and articles on everything from evergreen funds to due diligence (the kind of analysis that tells you what the GP pitch deck left out).
1️⃣ Private Credit
More marks, same information.
Apollo has started rolling out daily valuations across its roughly $850B credit business. Not everyone is thrilled. At the CAIS summit this week, Monroe’s Ted Koenig called daily marks on illiquid assets “an illusion of precision, not accuracy.”
Here’s the problem: a private loan doesn’t produce new information every day. The borrower sends financials quarterly, so between those reporting dates, a daily mark is a model’s output (and the model belongs to the manager).

You get more numbers, not more inputs. And most certainly not more precision. The analogy is a weather forecast that only updates once a week: you can refresh the page all you want, the result won’t change much.
Also worth mentioning: most of Apollo’s daily-valued book is investment grade. Which is not exactly the part of private credit keeping everyone up at night.

On that note, I wanted to share two new academic papers that explain why the who matters more than the how often.
Andrade and Lie looked at 4,655 loans held by multiple BDC sponsors and compared marks on the same loan, on the same date (you’ll find an amazing chart at the very end of the post, or by clicking here)
BDCs managed by the same sponsor mark a shared loan almost identically, with an average difference of just 0.026 cents. Across different sponsors, the gap is 1.13 cents (sounds like peanuts, but it’s more than 40x wider).
We’ve already seen this, of course. Remember Medallia?

What helps predict the gap? PIK (are you shocked, or what?)
Andrade and Lie find that “BDC sponsors with a larger share of assets in listed vehicles, whose investors exit at market prices rather than at NAV, assign higher marks to the same loan on the same date. The public–nonpublic gap is smaller for quoted than unquoted loans and widens with the sponsor’s share of payment-in-kind (PIK) income.”
Also, “The evidence fits the mechanism: paying exiting investors at NAV disciplines valuations and pushes funds toward liquid assets.”

Alexandra Dogaru (Berkeley Haas) reaches a similar conclusion from a different direction. Funds more reliant on PIK income mark identical loans higher than their co-holders, even when those loans pay in cash.
Her explanation comes down to incentives. PIK accrues into the income used to calculate incentive fees before a dollar is collected. Meanwhile, markdowns elsewhere shrink NAV and the fee base.
‼️Pay attention: the effect is statistically indistinguishable from zero in audited year-end reports (LOL, LMAO even). Apparently, the marks behave differently when someone else checks the homework.
Andrade and Lie have another finding that’s worthy of at least one❗️: sponsors that mark more conservatively are the ones whose funds have to buy back shares at NAV. Turns out, when your optimistic valuations will cost you in the price you pay investors who want out, you get more disciplined..
Those same non-traded BDCs hold 4.2 percentage points more of their assets in cash and quoted loans than their listed siblings (which makes sense because unlike their listed siblings, they have to pony up the cash to buy shares of exiting investors quarterly).
So what’s the stick that incentivizes a disciplined mark? Having to pay it, and having an auditor check it. And by the way, publishing the number daily does neither.
The flows flipped
For the first time since at least 2022, more money left non-traded BDCs than came in. PitchBook tracked 27 funds in Q2: $3.3B of new shares against $8.1B paid to exiting shareholders.
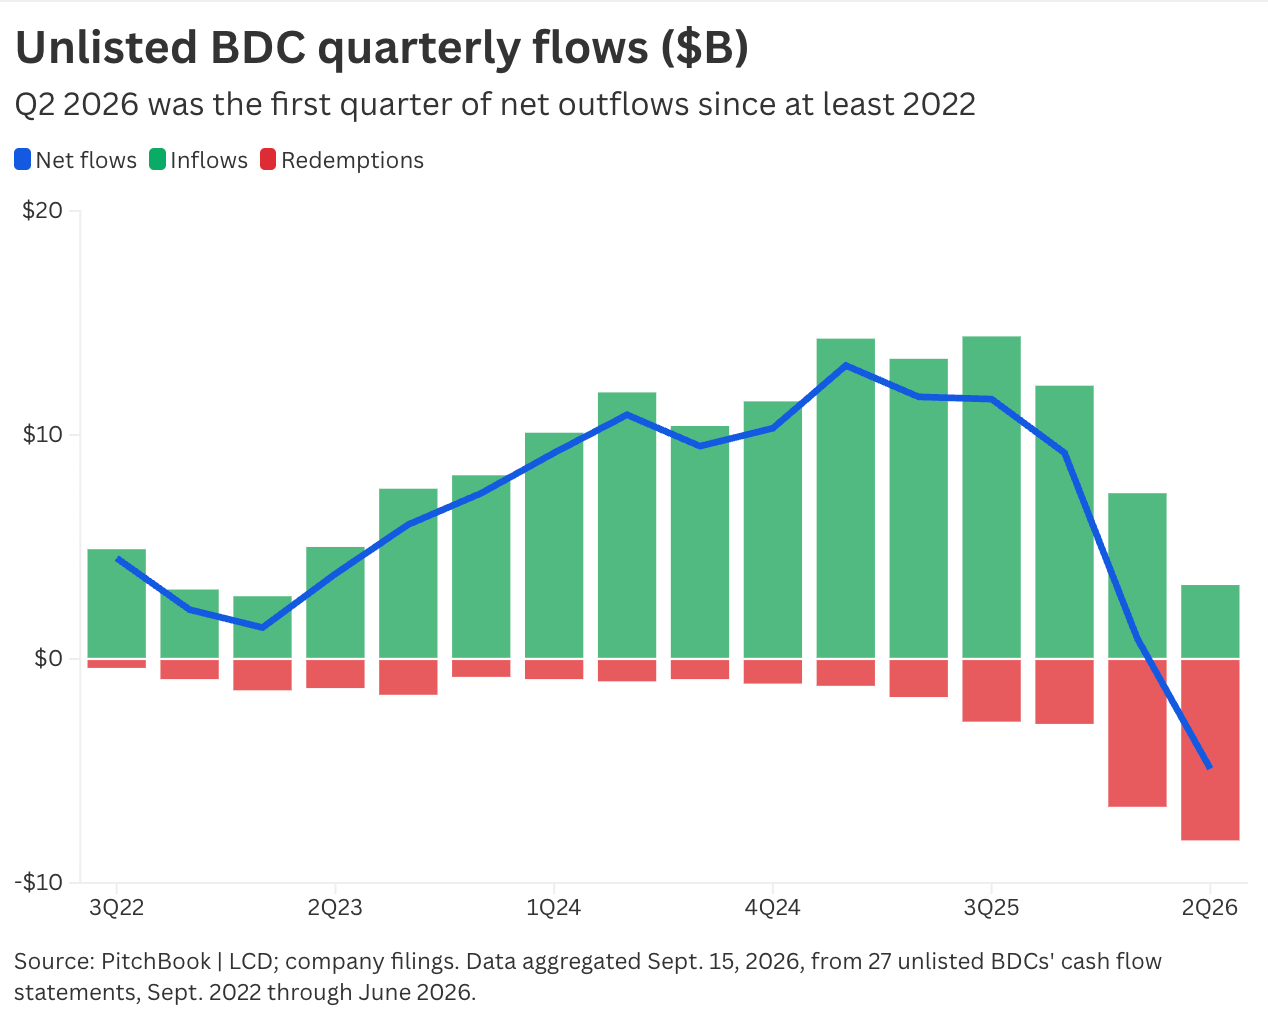
Fundraising fell to a multiyear low, from $13.4B a year earlier.
The 12 largest funds paid $7.6B against roughly $19.1B requested. BCRED alone received about $6.7B in requests, paid $3.2B, and took in $457M of new money.
Here’s why everyone heads for the exit at once:

Q3 requests eased a bit: OCIC at 16.8%, Apollo Debt Solutions at 14.7%, HLEND at 11.5%, and BCRED around 10%. The outlier is Blue Owl Technology Income Corp., or OTIC, where investors sought to withdraw $1.1 billion, equal to 39% of shares, up from 38.1% in the prior quarter (Reuters).
2️⃣ Private Equity
A continuation vehicle for a continuation vehicle
In 2021, General Atlantic moved four companies into a $3B+ continuation fund led by Ardian and HarbourVest. One of them, almost certainly Argus Media, is now headed for a second continuation vehicle.
GA filed for “GA Continuity II (AM)” on October 7, and Secondaries Investor reports Leonard Green’s Sage fund as lead buyer. The 2021 secondary buyers now get to choose: sell to Leonard Green or roll again.

The secondary market has developed a new business model: buy a continuation vehicle, hold the assets, and eventually sell them to another continuation vehicle. The industry calls these trophy assets.
Buyout firms are now raising dedicated funds to buy each other’s continuation vehicles. Leonard Green’s Sage closed at $3.6B. Hg just raised €1B at first close of Orion, targeting €1.75B, its first fund to buy other sponsors’ software CVs. GTCR, New Mountain, and Golub have similar vehicles.
How secondaries buyers make money on the discount:

None of this makes a CV a bad deal, of course. Sometimes a good asset deserves more time. But PitchBook found that most LPs choose to cash out of continuation vehicles rather than roll. The reasons often include fund life, investment mandates, and the transaction process (not necessarily a lack of confidence in the asset).
Which creates an interesting conundrum: the GP says the asset is too good to sell. Existing LPs mostly choose to sell. And often, the buyer is another buyout fund with a dedicated pool of capital for buying assets from other buyout funds.

3️⃣ Commercial Real Estate
Trepp tracks $636B of securitized multifamily debt. In August, $11.6B was delinquent. Of that, $5.8B sat in private-label CMBS, a 7.69% delinquency rate.
Freddie Mac carries 82% of the balance but has a 0.80% rate. CRE CLOs carry $41B at 3.88%.
Two years ago, CRE CLOs were the problem child, accounting for 40% of delinquent debt at a 6.05% rate. Today, they account for just 14%.

So, did CRE CLOs clean up their act?
Partly, the loan mix changed. CLO debt on pre-1980 buildings fell from $16.2B to $6.8B, while private-label debt on those same vintages rose from $20.4B to $29.1B.
But there is another wrinkle. CRE CLO managers can pull defaulted loans out of the pool, and they have reasons to do so. If a deal fails its over-collateralization test, cash that would otherwise go to equity and junior noteholders gets diverted to pay down senior notes.
A delinquent loan leaving the CLO can therefore change the reported numbers and the deal’s cash-flow dynamics. It does not, however, magically make the loan perform.
So when we read delinquency data, a falling rate can reflect better credit performance, a changing loan mix, or a change in what’s still being counted. Those are three very different stories.
The broader trend hasn’t turned, either. Trepp’s overall CMBS delinquency rate hit 8.02% in September, the highest since late 2020, while CMBS multifamily rose to 8.04%.
That’s it for this week.
If someone forwarded this to you, subscribe. If you’re the one who forwards it, thank you.
-Leyla
P.S. Here’s the promised chart:
P.P.S. New here?
Here’s where you’ll find the full archive (somewhat organized):
