

Evergreen Funds, Part 2
How capital deployment shapes returns

Happy New Year! 🥳
One of the major themes I expect to shape private markets in 2026 is the continued growth of evergreen vehicles targeting retail and wealth investors. For that reason, it felt appropriate to make this the inaugural post of the year.
In Part 1, we covered how evergreen funds are structured, and why incentives, liquidity mechanics, and valuation matter more than the marketing suggests:

In Part 2, we tackle a harder question:
How do evergreen funds actually compare to traditional drawdown funds on performance, risk, and LP outcomes?
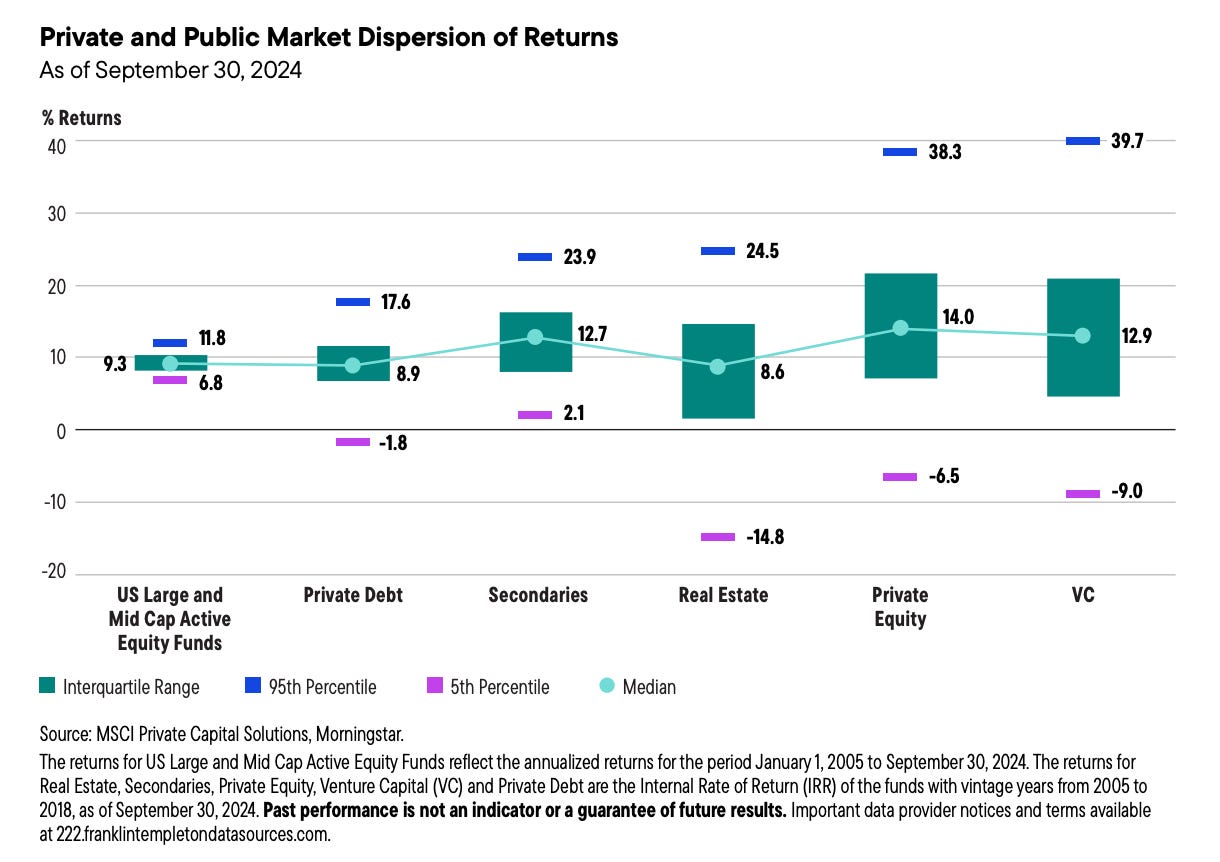
‼️ Before we get any further, let me underscore the most important thing. In private markets, the only thing that ultimately matters is manager selection.
The chart below makes this point very clear. Don’t shoot the messenger: the structure of the fund will not make up for poor returns of a manager who lands in the 5th percentile.
That said, structure does influence how returns are reported, and compounded, so let’s jump in.
Looking for some case studies on evergreen vehicles? Here are a few:


The Metric Problem
One of the biggest sources of confusion is how performance is measured.
Drawdown Funds
Traditional private equity funds are typically evaluated using:
IRR
DPI (Distributions to Paid-In Capital)
TVPI (Total Value to Paid-In Capital)


These metrics reflect how drawdown funds actually function:
Capital is called irregularly and deployed over several years
Performance is driven primarily by realized exits
Returns are subject to the J-curve
Cash flows are lumpy and unpredictable
Evergreen Funds
Evergreen vehicles, by contrast, are typically measured using: