

PE Fundraising 📉, PC Redemption Wave, and Record Vacancy
🗞️ Sunday digest: private markets insights 4/19

Happy Sunday!
Every other week, we send a quick digest on what’s catching our eye across private markets - a quick rundown of things you need to know.
Today’s lineup:
1️⃣ Private equity: strong deal activity, weak fundraising, and what managers are watching next.
2️⃣ Private credit: redemption wave builds, regulatory scrutiny, and more data on SaaSpocalypse
3️⃣ Commercial real estate: record leasing and record vacancy, all at once
Before we dive in:
Accredited Insight delivers the LP’s perspective on private credit, private equity, and CRE, drawing on hundreds of deals, and thousands of conversations. Paid subscribers gain access to our database of over 40 case studies and articles on everything from evergreen funds to due diligence.
1️⃣ Private Equity
Two reports this week offer complementary views on where PE stands.
1. PitchBook’s Q1 2026 Global PE First Look
PE delivered a healthy first quarter despite resurfaced tariff uncertainty, the ongoing conflict in Iran, and compounded by growing concerns in private credit:
Over 5,100 transactions totaling $481.6 billion closed in Q1, pacing ahead of Q2 2025 (remember Liberation Day?)
On exits, Q1 logged 975 transactions worth $306.7 billion. With $2 trillion in dry powder and more attractive borrowing costs, sponsors are well-positioned to keep capital moving.
❗️The one clear weak spot is fundraising. Q1 funds raised just $86 billion (roughly in line with Q1 2025 and likely setting the industry up for another challenging year).
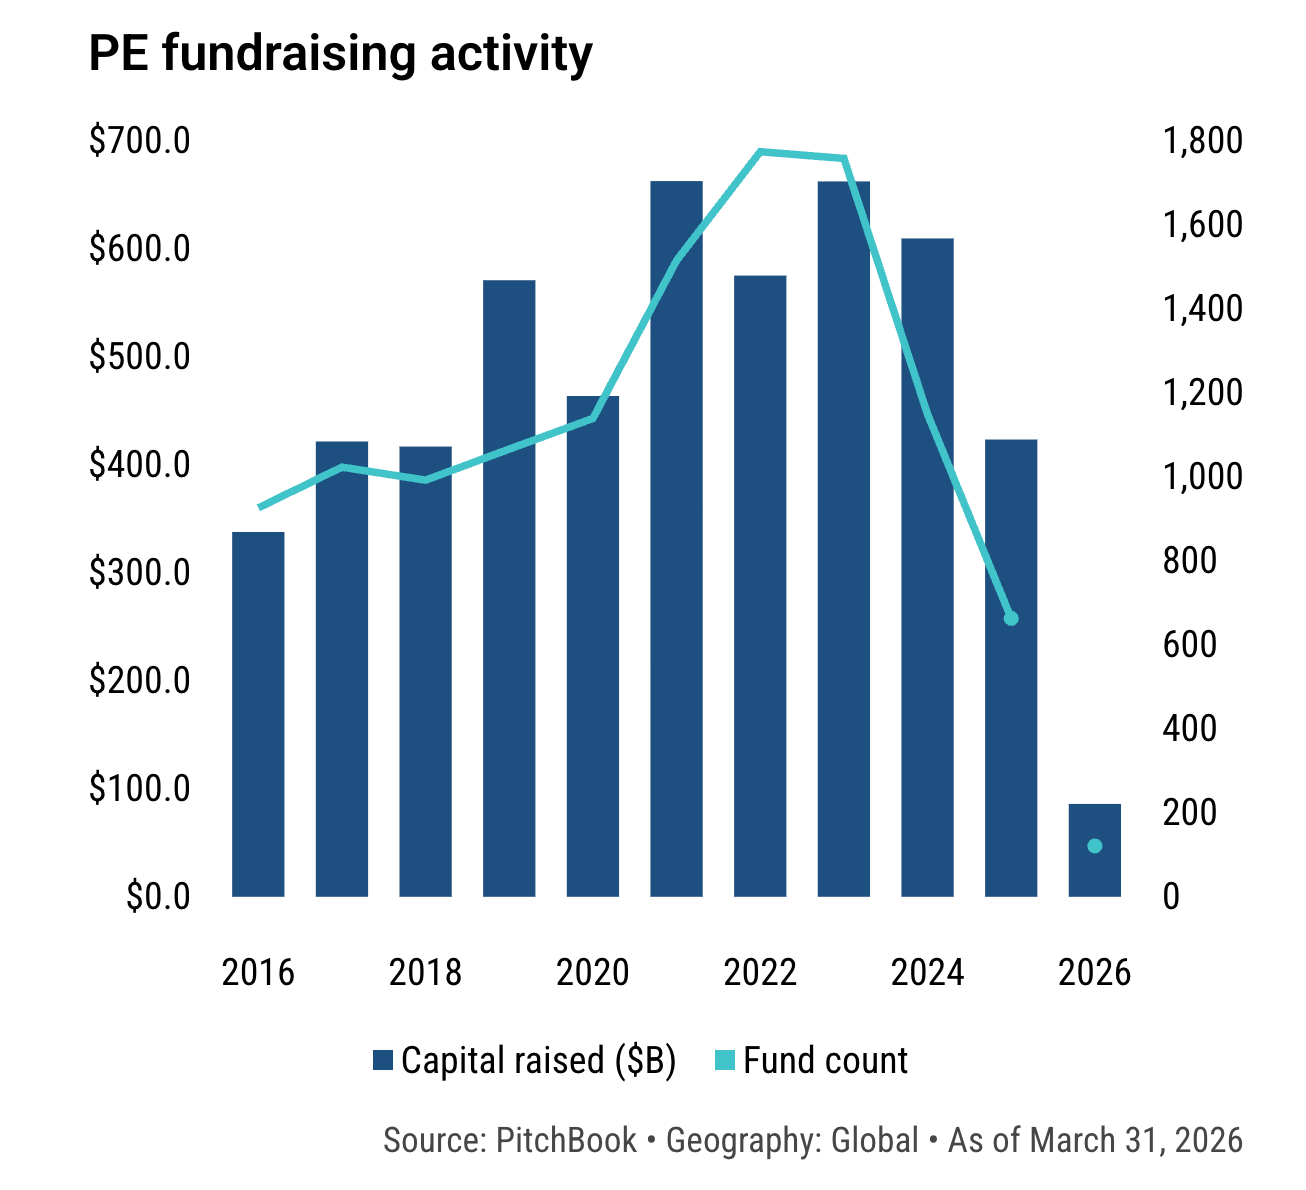
The issue on the LP side is structural: many are short on capital for new allocations, as exit activity has yet to fully offset the prolonged period of limited distributions.
2. S&P Global’s 2026 PE survey
71% of GPs now rank operational improvements as their top value creation lever, ahead of financial engineering.
👉 How do you pick a skilled PE manager when all of them claim outstanding operational capabilities? Read this:

Nearly half (46%) anticipate a shake-out of mid-tier managers unable to generate distributions.
53% flag deteriorating credit quality as the greatest risk to private credit markets in 2026.
Check out the chart in this post, it goes with the above, I promise:

2️⃣ Private Credit
Last time we covered Apollo, Ares, and BlackRock gating in March, there is more:
1. The wave continues 🌊
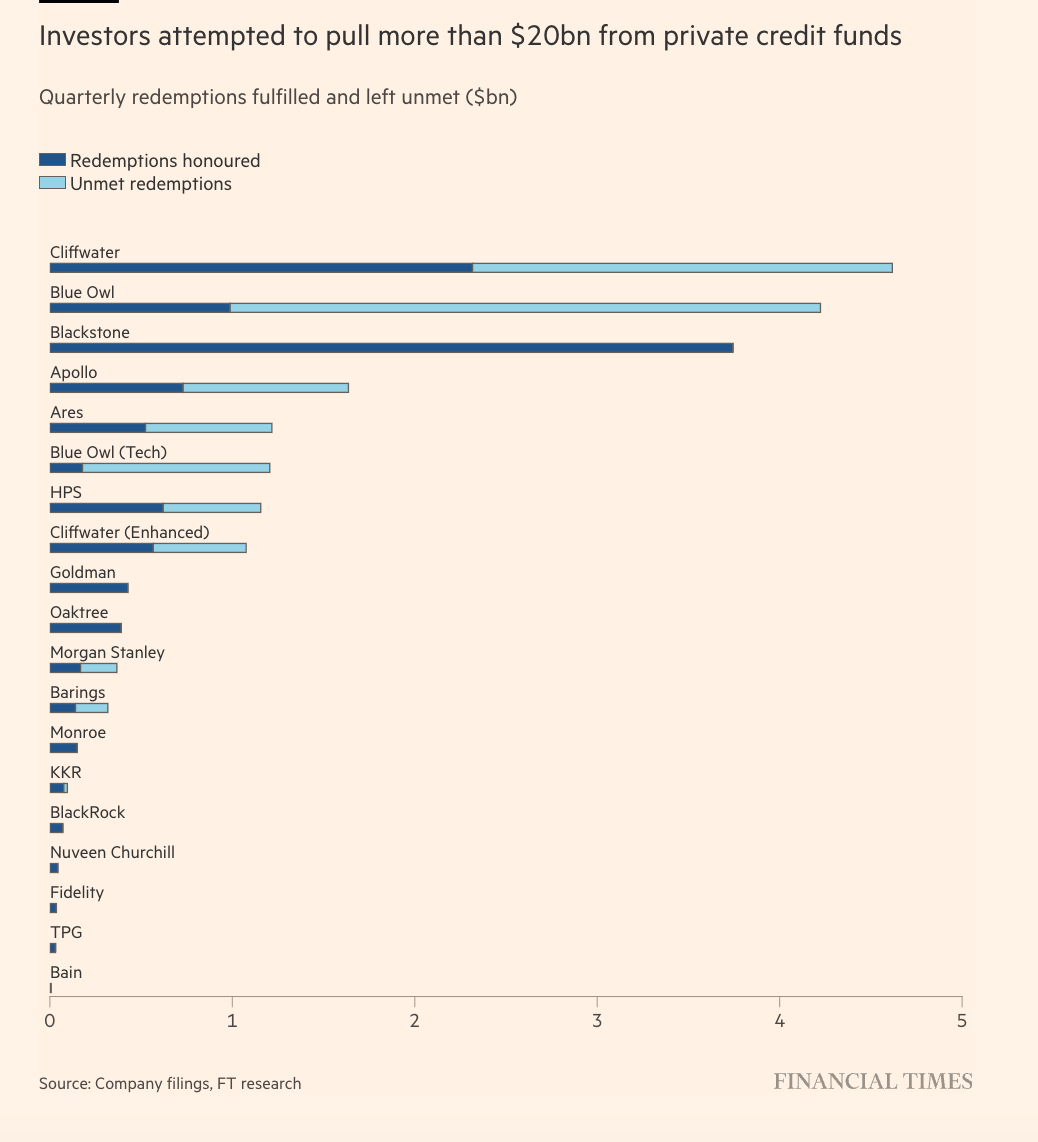
Carlyle’s $7 billion Tactical Private Credit Fund capped redemptions after investors sought to pull 15.7% of shares in Q1 (Bloomberg), more than 3x its 5% quarterly limit.
In total, individual investors requested over $20 billion in redemptions from private credit firms in Q1 (FT)
Regulators are now paying close attention. The Federal Reserve is asking major U.S. banks to share details about their private credit exposure, to assess the level of stress in the sector and its potential to spill into the wider financial system (Fortune)
Meanwhile, the Treasury Department announced it will convene a series of meetings with domestic and international insurance regulators focused on recent developments in private credit markets. (U.S. Department of the Treasury)
‼️ Speaking of regulators: we’ve argued that using NAV as a practical expedient in semi-liquid secondary funds (while allowing managers to crystallize carry on unrealized gains) can create a major incentive misalignment. Mark Higgins, CFA, CFP , TheAltView and I asked FASB to review the issue as newer-vintage funds increasingly shift toward getting paid on paper gains earlier. Institutional Investor covered it here.
👉 This is an example of a fund that uses this practice to crystallize the incentive fee on unrealized gains:

And this one earns it on income only:

2. The AI/Software Problem
The question behind the redemption surge: what’s actually in these portfolios?
According to Bank for International Settlements, outstanding loans to SaaS firms grew from roughly $8 billion in 2015 to over $500 billion (about 19% of total direct loans) by 2025. A third of private credit funds now have exposure to the SaaS sector.
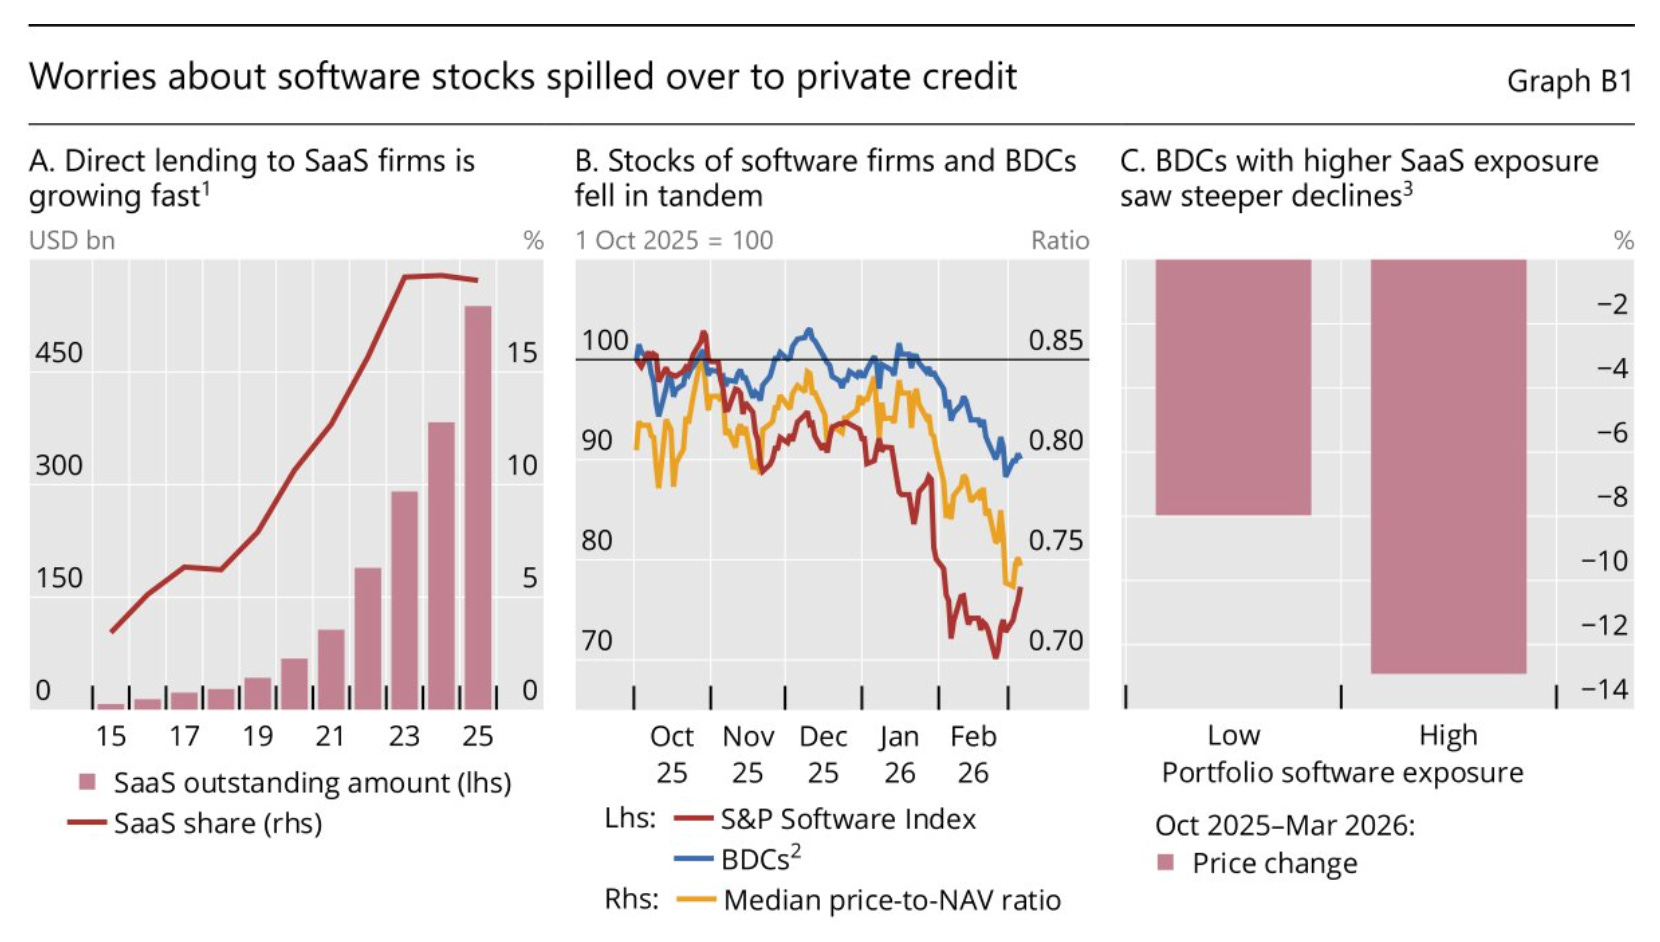
Here’s a fund with high software exposure:

The recent liquidity crunch appears tied to a mix of AI/software disruption fears, broader market unease, and the realization that inflows could no longer absorb outflows. Once headlines around withdrawal requests hit, additional redemption pressure likely followed.
👉 Wealth advisers face a classic prisoners’ dilemma when it comes to redemptions. And there is only one rational move:

The manager defense: PE owners, not lenders, are first in line to absorb losses if software buyouts deteriorate. True. But it also means the PE marks haven’t moved yet.
👉 Need to understand how gating actually works?

3️⃣ Commercial Real Estate
The office market managed to hit two records simultaneously in Q1 (a good one, and a not-so-good one).
On the leasing side, office tenants signed new leases for an estimated 120 million square feet in Q1 2026:
the strongest quarterly total since mid-2018,
a 25% increase year-over-year,
and the first time this decade that quarterly volume exceeded its pre-2019 average.
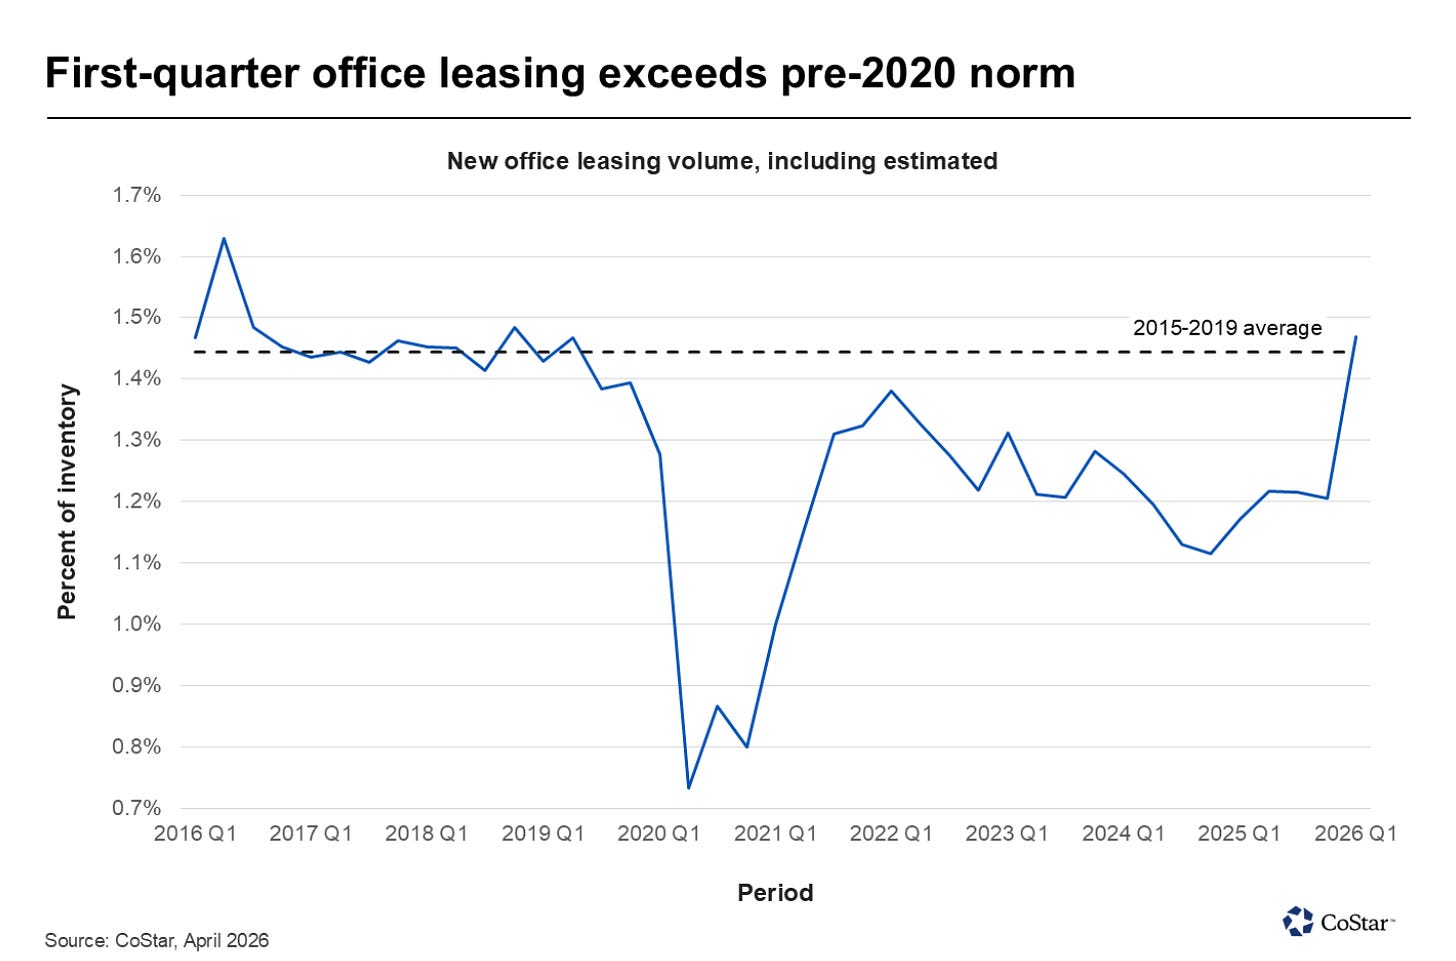
Source: CoStar
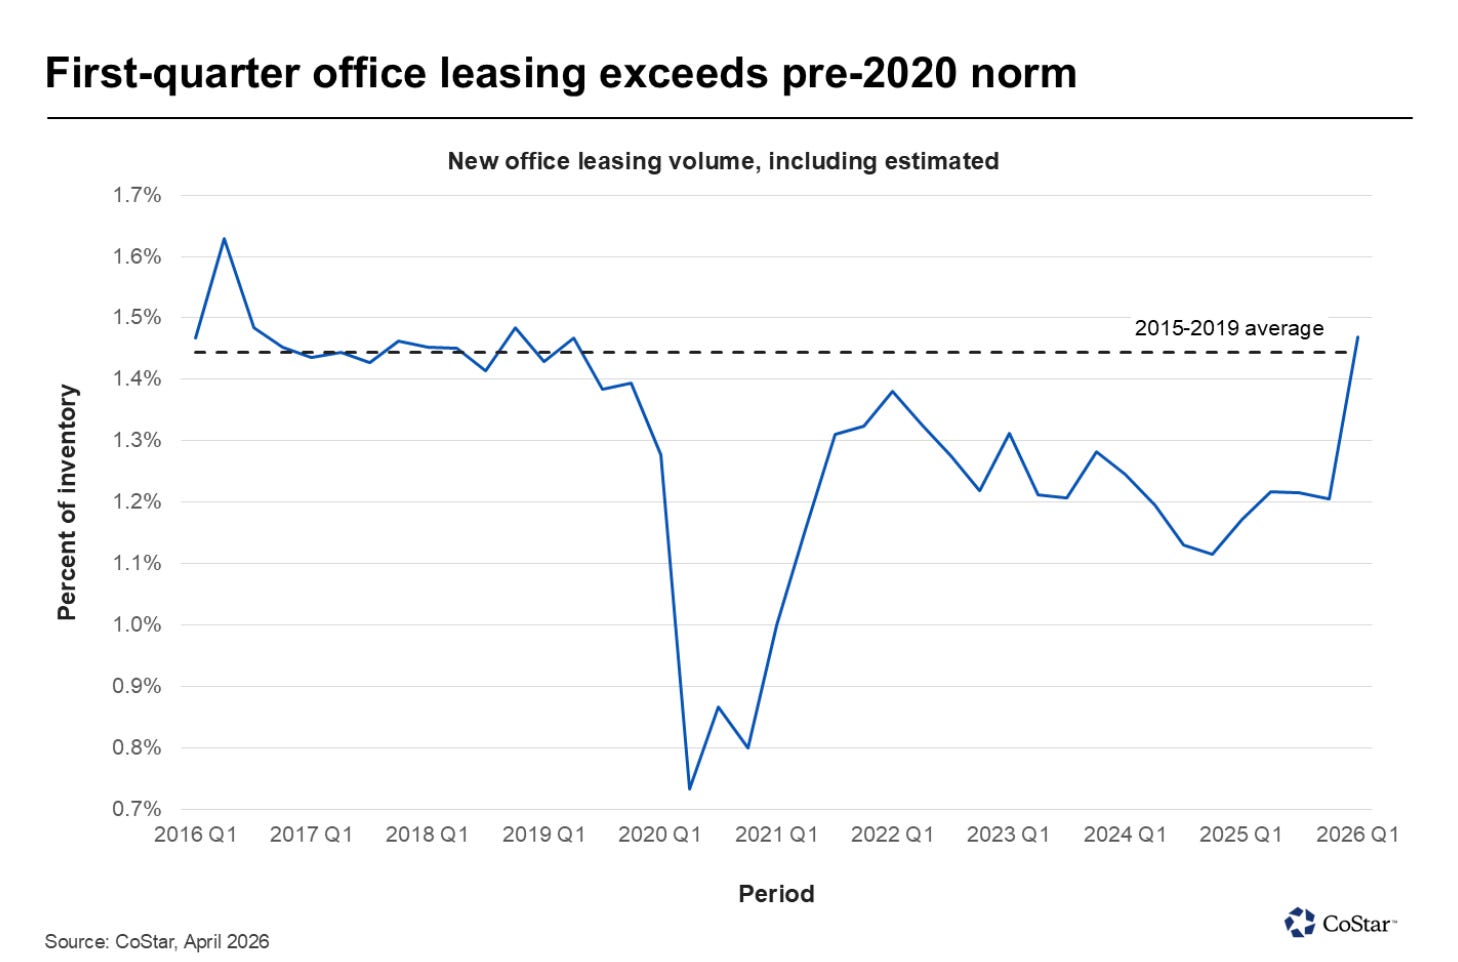
The recovery isn’t being driven by a handful of mega-deals either: the number of individual lease transactions was the highest observed in a decade.
On the vacancy side, the picture is not so stellar:
U.S. office vacancy hit 21% in Q1 (a new record, up 60 bps year-over-year and now 4 percentage points above where it stood at the start of the pandemic in 2020).
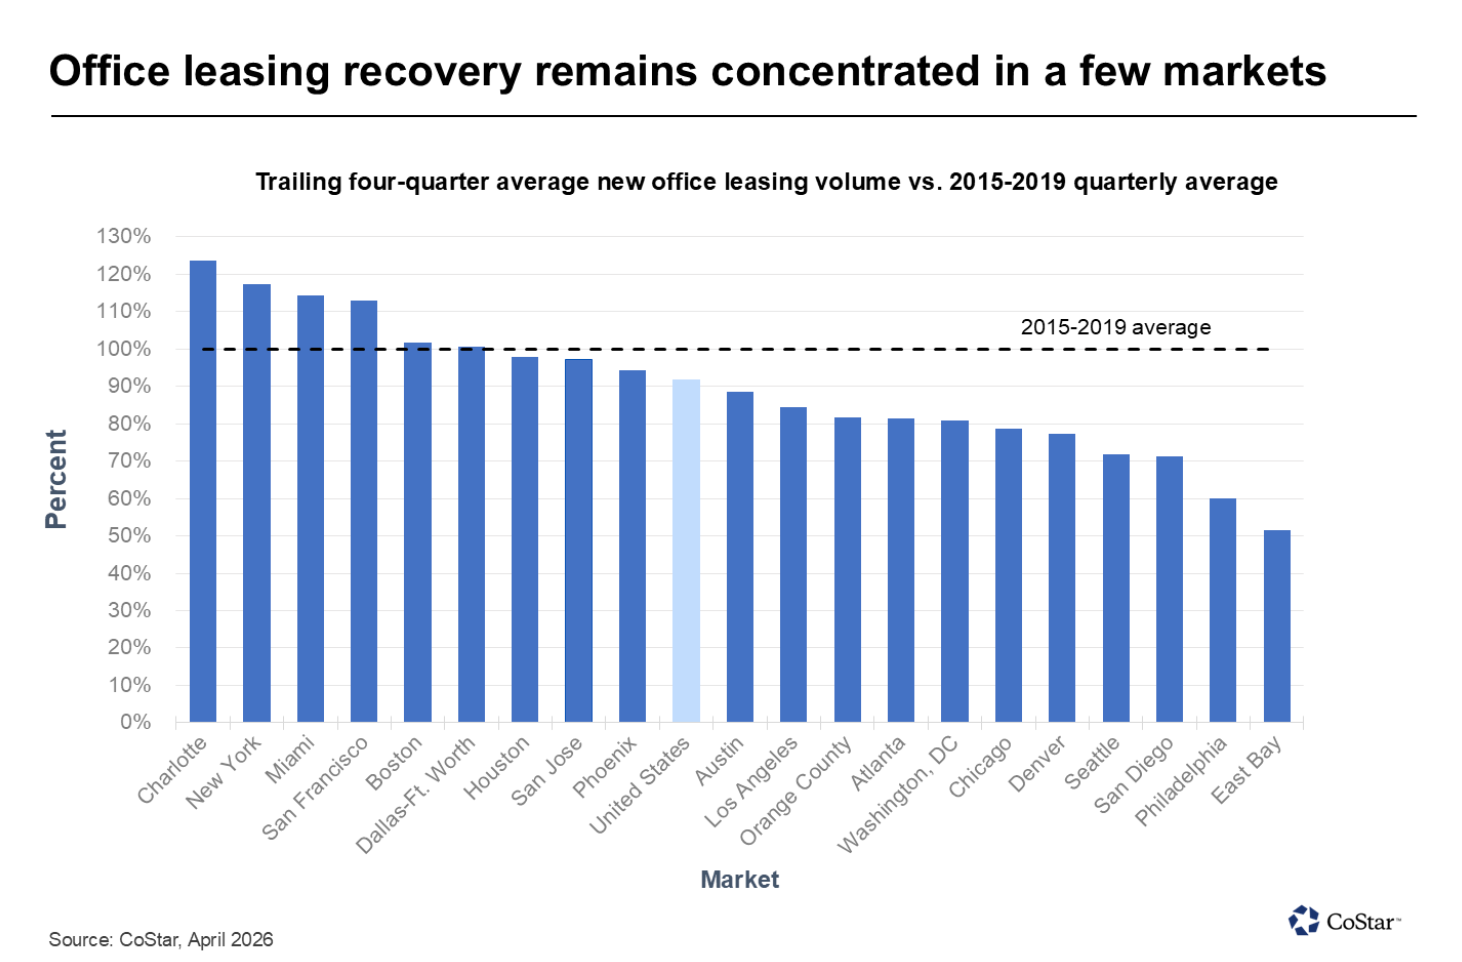
Ten of the last 13 quarters have shown net contraction in occupied office stock, with Q1 seeing an overall decline of 5.2 million square feet. Oakland, Austin, Chicago, and San Jose led the losses. Moody’s expects vacancy to keep rising through 2026 as more legacy leases expire.
Tenants are signing more leases, but for smaller footprints in higher-quality space. The result is record leasing activity and record vacancy occurring simultaneously.
❗️For LPs, the implication is that top-line CRE metrics are increasingly unreliable; submarket, vintage, and asset quality are doing most of the work.
Side note: I’m seeing pitch decks with AAR 😱 Here’s why you need to pay attention:

Elsewhere across asset classes, Moody’s reports broadly stable but unspectacular performance:
Multifamily rent growth came in under 1% with vacancy ticking up to 6.8%, with Sun Belt markets bearing the brunt of new supply.
Retail held flat at 10.4% vacancy.
Industrial vacancy edged up to 8.4% (its highest since 2021) as new inventory narrowly outpaced occupancy gains.
P.S. New here?
Here’s where you’ll find the full archive (somewhat organized):

Thanks for reading! As always, if you have any suggestions, reply to this email, leave a comment, or find me on socials (unhinged version on X, and a slightly proper version of me on LinkedIn)
-Leyla
Would like to know where FT got the Cliffwater figures from. No company filings disclosed on SEC that I can see
Can you expand on what “financial engineering” is referring to in this quote?
“71% of GPs now rank operational improvements as their top value creation lever, ahead of financial engineering.”
Are there ever valid financial engineering strategies?